Retracement MT4 Indicator by PipTick
- Indicadores
-
Michal Jurnik
 "Talent is cheaper than table salt. What separates the talented individual from the successful one is a lot of hard work." - Stephen King. Those few words reflect myself very well. I am probably not the most talented developer in the world but I truly believe in hard work, professional attitude and
 - Versión: 1.0
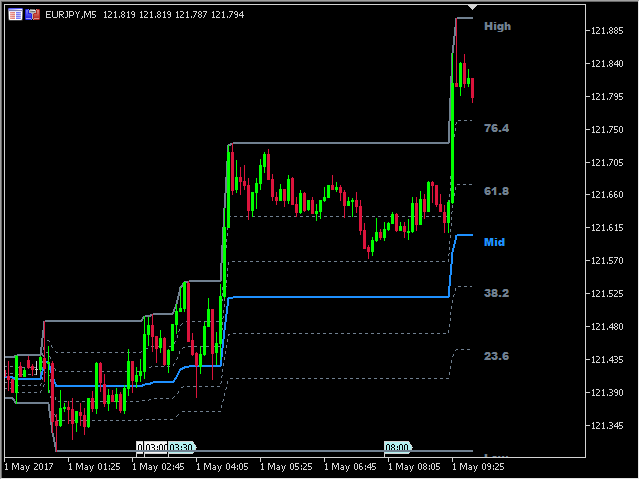
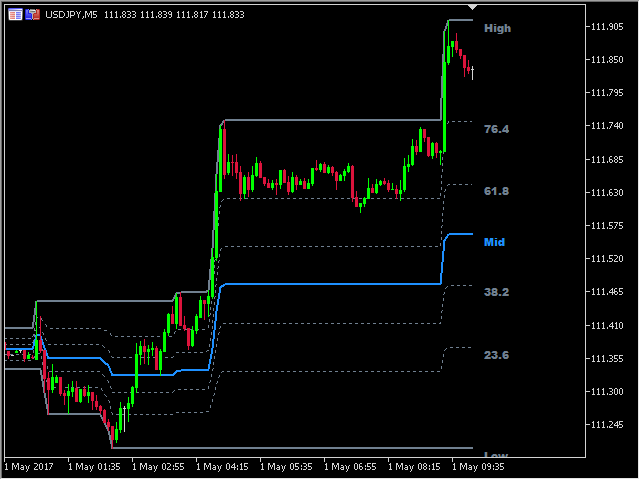
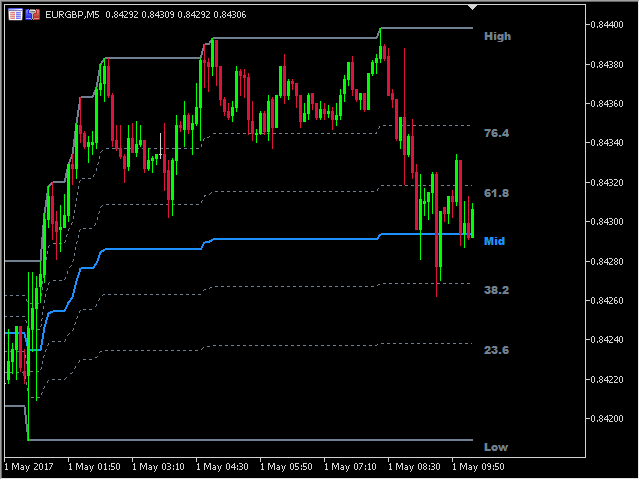
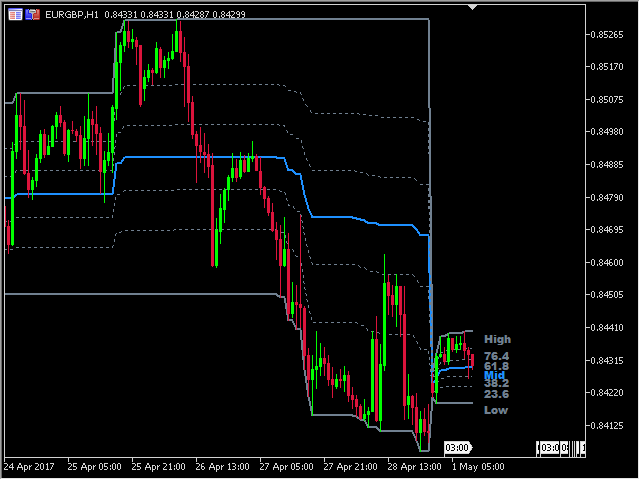
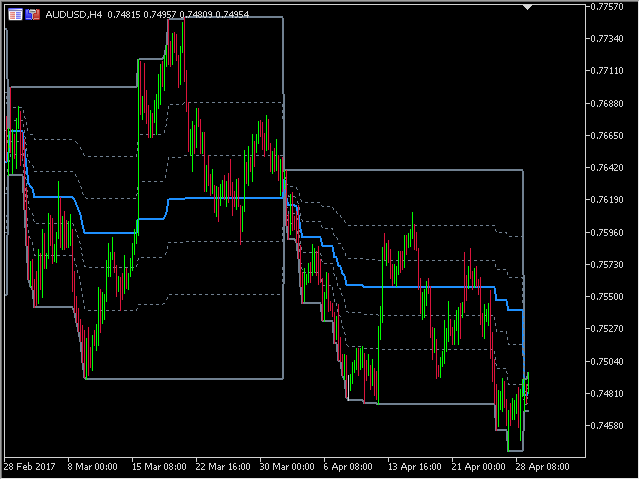
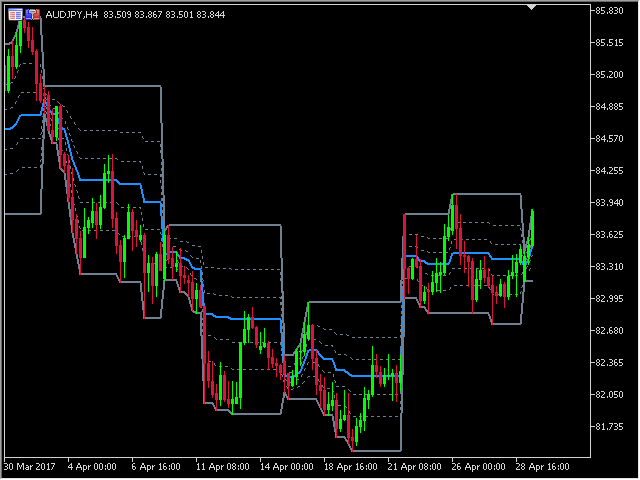
Elindicador de retroceso muestra los valores máximos, mínimos y medios actuales e históricos. Opcionalmente, también puede mostrar los principales niveles de retroceso. Todos estos niveles juntos forman los niveles significativos de soporte y resistencia. Por lo tanto, es esencial conocerlos para todo tipo de operador.
Niveles
- Alto
- Bajo
- Punto medio
- 76,4 %
- 61,8 %
- 38,2 %
- 23,6 %
Características principales
- El indicador muestra los niveles actuales de Máximo, Mínimo, Medio y los retrocesos seleccionados.
- Cuatro niveles de retroceso opcionales.
- Notificaciones de alerta para las líneas del indicador.
- Tiempo de sesión personalizado.
- Funciona en todos los marcos temporales (M1, M5, M15, M30, H1, H4, D1, W1, MN).
- El indicador no repinta.
- Listo para backtesting.
- Parámetros personalizables (Colores, Grosor de línea, Visibilidad...).
- Alta velocidad de cálculo.
- Disponible para MT4 y MT5.
Por favor, visite la página de producto del indicadorRetracementpara la configuración de los parámetros de entrada y salida.