Fibonacci Retracement MT5 Indicator by PipTick
- Indicadores
-
Michal Jurnik
 "Talent is cheaper than table salt. What separates the talented individual from the successful one is a lot of hard work." - Stephen King. Those few words reflect myself very well. I am probably not the most talented developer in the world but I truly believe in hard work, professional attitude and
 - Versión: 1.1
- Actualizado: 1 diciembre 2021
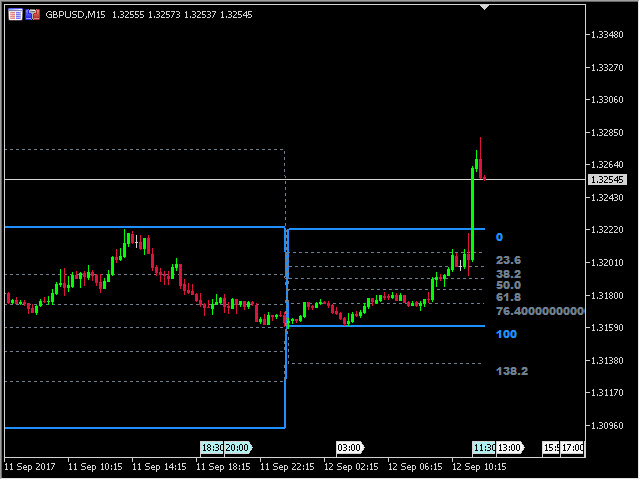
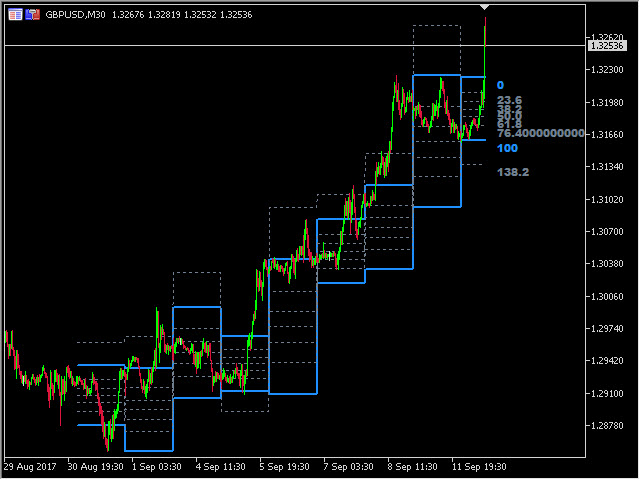
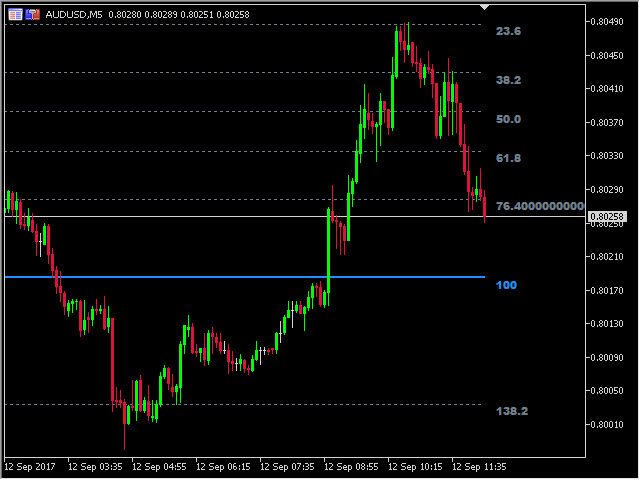
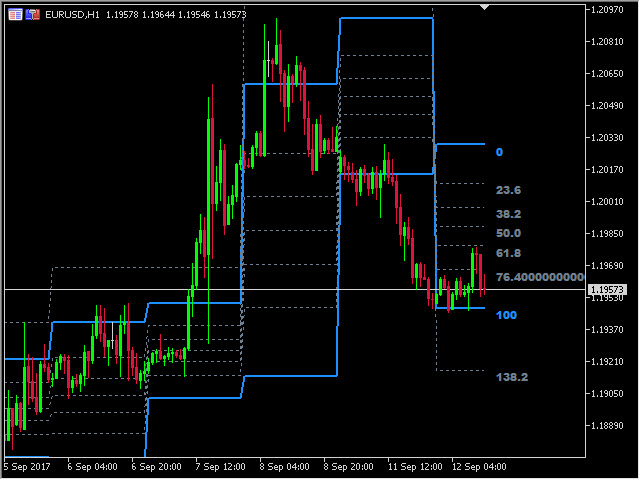
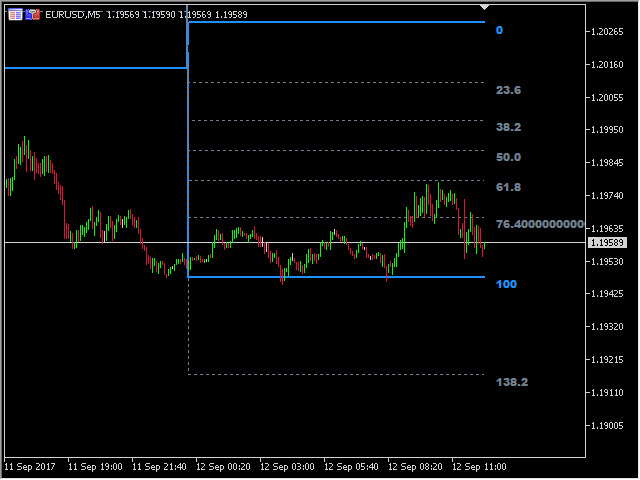
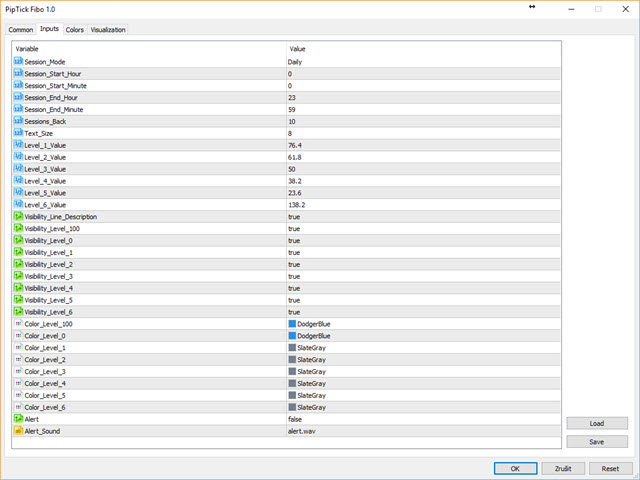
Elindicador Fibonacci muestra automáticamente los niveles de retroceso de Fibonacci, que representan soportes y resistencias significativos. El intervalo para calcular el indicador puede tomarse del día, la semana, el mes, el año o la sesión anterior especificada por el usuario.
Niveles
- 100 % (Máximo) del intervalo de la sesión anterior.
- 0 % (mínimo) del rango de la sesión anterior.
- 76,4 % del rango de la sesión anterior.
- 61,8 % del rango de la sesión anterior.
- 50 % del intervalo de la sesión anterior.
- 38,2 % de la horquilla de la sesión anterior.
- 23,6 % de la horquilla de la sesión anterior.
- 138,2 % de la horquilla de la sesión anterior.
Recomendaciones
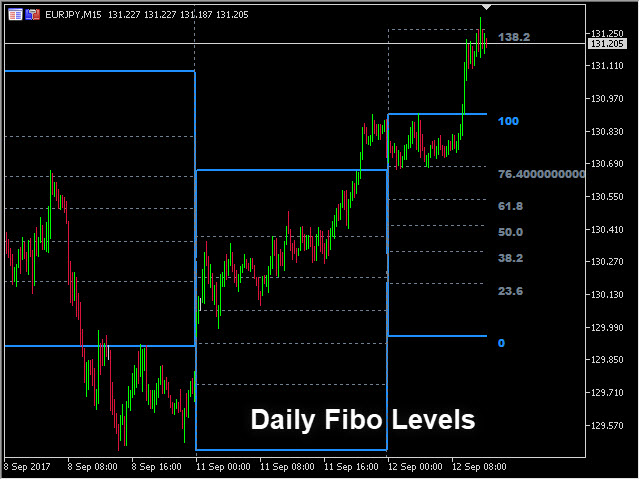
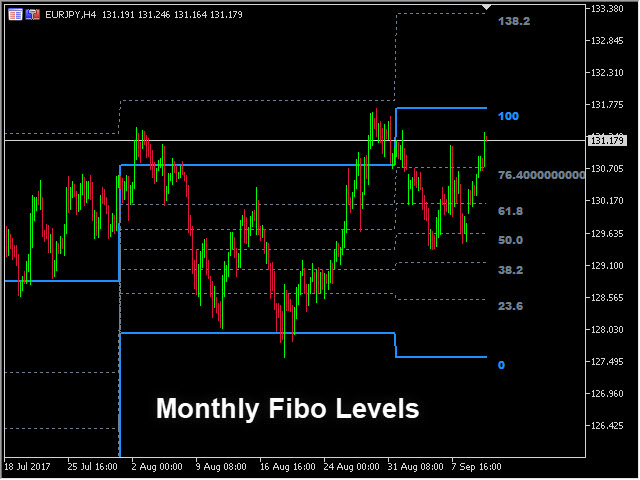
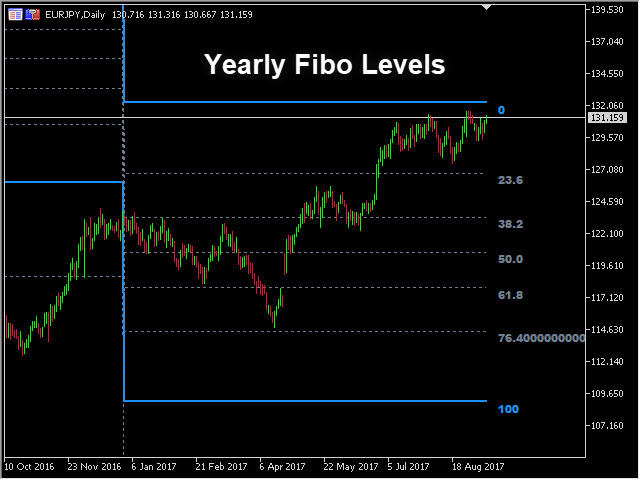
- Es ventajoso insertar varias copias de nuestro indicador en el gráfico y observar los niveles de las sesiones diaria, semanal y mensual. Suelen funcionar muy bien como fuertes niveles de soporte y resistencia.
Características principales
- El indicador muestra el Fibonacci del rango de la sesión anterior.
- Seis niveles definibles por el usuario.
- Notificaciones de alerta para las líneas del indicador.
- Tiempo de sesión personalizado.
- Funciona en todos los marcos temporales (M1, M5, M15, M30, H1, H4, D1, W1, MN).
- El indicador no repinta.
- Listo para backtesting.
- Parámetros personalizables (Colores, Grosor de línea, Visibilidad...).
- Cálculo de alta velocidad.
- Disponible para MT4 y MT5.