Volume Weighted ATR MT5 Indicator by PipTick
- Indicadores
-
Michal Jurnik
 "Talent is cheaper than table salt. What separates the talented individual from the successful one is a lot of hard work." - Stephen King. Those few words reflect myself very well. I am probably not the most talented developer in the world but I truly believe in hard work, professional attitude and
 - Versión: 1.2
- Actualizado: 3 diciembre 2021
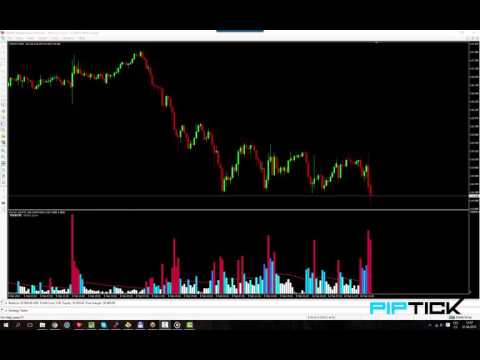
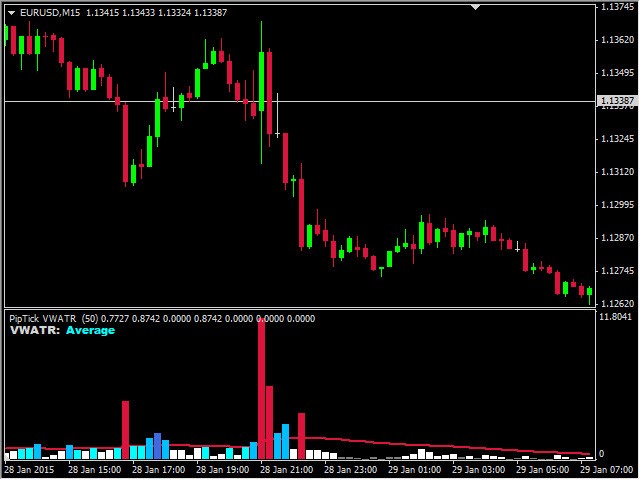
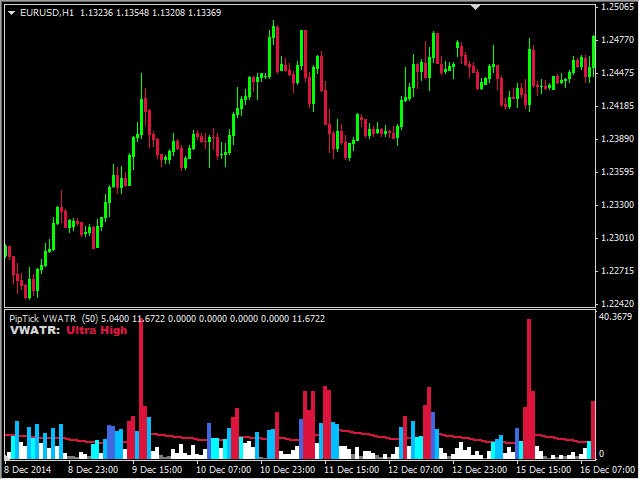
El indicador ATR ponderado por volumen es una herramienta útil para medir la actividad del mercado. Se basa en la idea del ATR ponderado por volumen. La combinación de estos dos elementos ayuda a identificar posibles puntos de inflexión u oportunidades de ruptura. El indicador para la clasificación de la actividad del mercado utiliza la media móvil y sus múltiplos. En consecuencia, donde se encuentra la barra VWATR (en relación con la media móvil), se etiqueta como ultrabaja, baja, media, alta, muy alta o ultraalta. El indicador ATR ponderado por volumen se representa como un histograma.
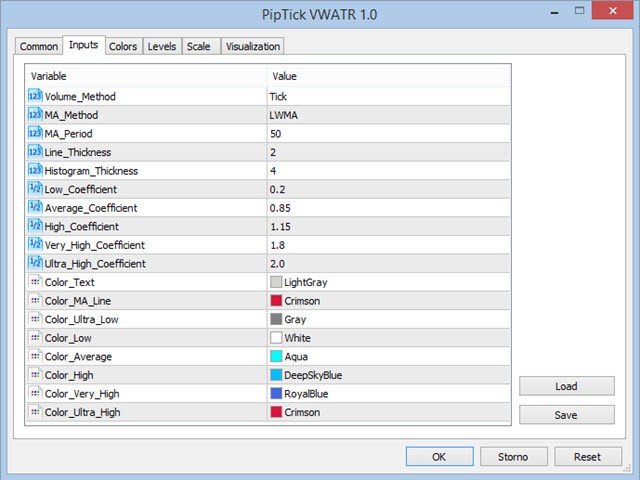
Este indicador puede calcular la media móvil mediante cuatro métodos:
- SMA - Media móvil simple.
- SMMA - Media móvil suavizada.
- EMA - Media móvil exponencial.
- LWMA - Media móvil ponderada lineal.
Interpretación
Por defecto, hay seis zonas que pueden ser modificadas por el usuario. Dependiendo de la zona que corresponda al indicador ATR ponderado por volumen, la barra del histograma se colorea con el color adecuado.
- Zona Ultra VWATR - Carmesí.
- Zona VWATR bajo - Blanco.
- Zona VWATR Media - Aqua.
- Alto VWATR zona - DeepSkyBlue.
- Zona VWATR muy alta - AzulReal.
- Zona VWATR ultra alta - Azul.
Características principales
- Una clasificación sencilla de la actividad de los mercados.
- Varios métodos de cálculo opcionales.
- Cálculo del volumen real y por ticks.
- Rangos de las zonas seleccionables por el usuario.
- Funciona en todos los marcos temporales (M1, M5, M15, M30, H1, H4, D1, W1, MN).
- Indicador muy rápido y fiable.
- Parámetros personalizables (colores, grosor de línea, periodo MA...).
- Se puede utilizar para crear EA (Expert Advisor).
- Disponible para MT4 y MT5.


Great Indicator. Also because it is free. It goes on every chart for me. What I really like are the clear spikes that I can see. I do miss a level alert. Thank you.