VWAP Daily
- Indicadores
-
Anton Polkovnikov
 MOEX intraday trader.
Developing scripts for MT5.
I'm on Telegram: @stockgambler
My Telegram group: https://t.me/stockgamblers - Versión: 1.0
- Activaciones: 5
Indicador del precio medio ponderado o VWAP.
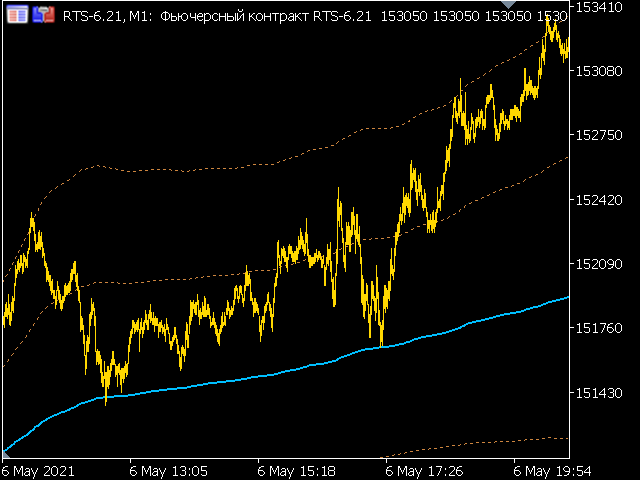
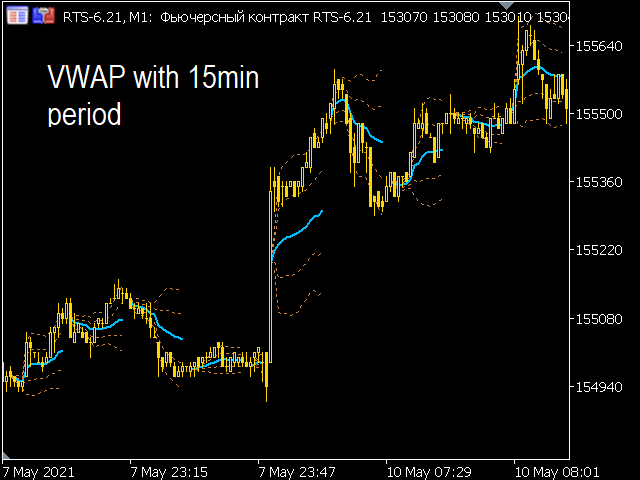
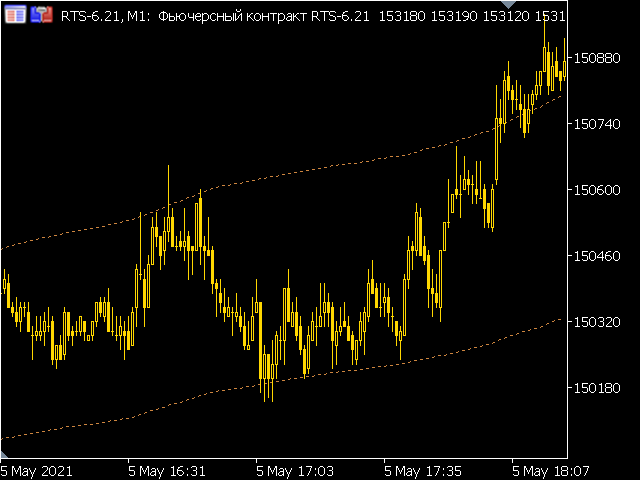
El conocido VWAP estándar con el comienzo del día se añade con la función de seleccionar la periodización. Se puede calcular tanto cada día como en otros periodos. También el indicador permite excluir el volumen del cálculo, lo que permitirá utilizarlo en las criptodivisas y forex. Hay una alerta para un cruce de precios VWAP. Hay 1 y 2 desviación estándar.
Ajustes:
- Volumen: activar y desactivar el volumen en el mecanismo de cálculo.
- Período: selección del período de representación VWAP (15 min, 30 min, 1 hora, 2 horas, 4 horas, día)
- Inicio día: configuración del inicio del día para un periodo V_DAY
- Color: color del VWAP
- Sigma Color: color de la desviación estándar
- Sigma 1 Visible: permite visualizar la primera desviación estándar
- Sigma 2 Visible: permite visualizar la segunda desviación estándar
- Bar's Quantity: número de velas en las que se muestra el indicador