TrendReverse
- Indicadores
-
Puiu Alex
 I am fulltime trader with over 13 years of forex experience. I developed my own strategy based on supply/demand levels and trend follow!
Motto: Take what you need and leave, don't look back! - Versión: 1.30
- Actualizado: 3 noviembre 2021
- Activaciones: 7
Diferencia entre un cambio de tendencia y un retroceso
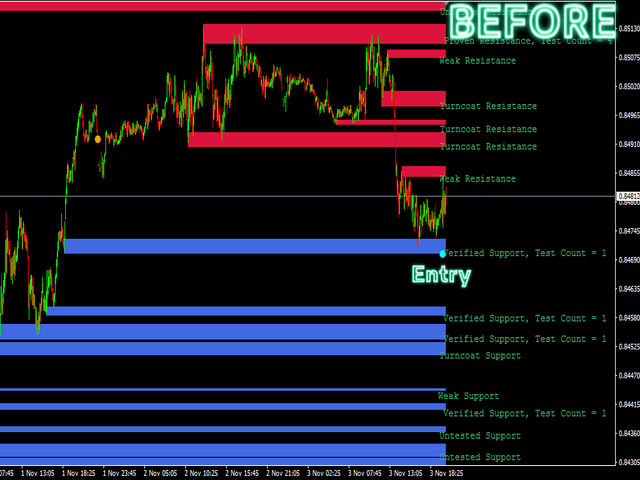
Una inversión es un cambio de tendencia en el precio de un activo. Un retroceso es un movimiento contrario dentro de una tendencia que no invierte la tendencia. Una tendencia alcista se crea mediante máximos y mínimos oscilantes más altos. Los retrocesos crean los mínimos más altos. Por lo tanto, una inversión de la tendencia alcista no se produce hasta que el precio hace un mínimo más bajo en el marco de tiempo que el operador está observando. Los retrocesos siempre comienzan como retrocesos potenciales. En el momento de su inicio, se desconoce cuál será finalmente.
El indicador le dará señales cuando haya una alta probabilidad de reversión, pero en realidad usted operará un retroceso hasta que se convierta en una tendencia.
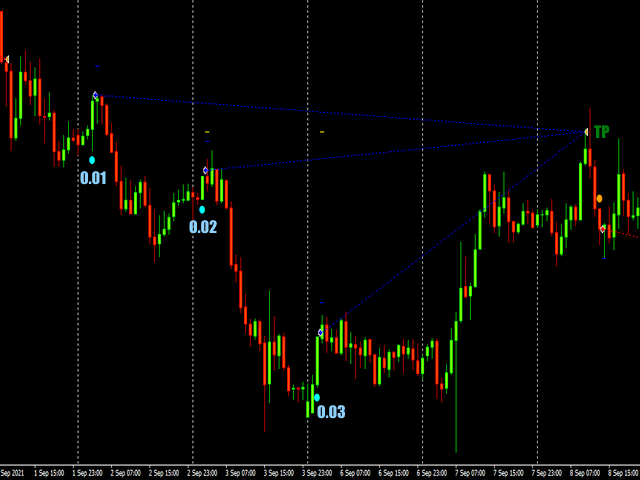
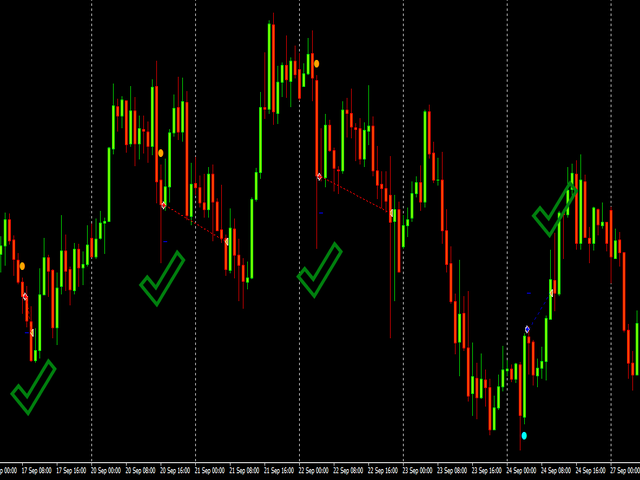
¿Es rentable este indicador?
Sí.
Ver las capturas de pantalla para ver mi estrategia .
Características:
Scalping
Trend TF - M15
CalculateOnBarClose1 - 1
Trend1 - 100
Trend2 - 100
Entry TF - M15
Entry Period - 8
Tendencia
CalculateOnBarClose1 - 1
Trend1 - 950
Trend2 - 1350
Entry TF - H1
Entry Period -21
Tendencia fuerte
CalculateOnBarClose1 - 1
Tendencia1 - 950
Tendencia2 - 1350
Entry TF - H4
Entry Period -21
Habilitar Alertas - true/false
Habilitar Notificaciones Push - true/false
Retraso de Alerta (Velas) - 1
Habilitar Flechas/Alertas de Scalping - true/false
Habilitar Flechas/AlertasdeTendencia - true/false
Habilitar Flechas/Alertas de Tendencia Fuerte - true/false
Distancia entre Señales Scalping - 30
Distancia entre Señales Tendencia - 50
Distancia entre Señales Tendencia Fuerte - 100