TrendReverse
- Indikatoren
-
Puiu Alex
 I am fulltime trader with over 13 years of forex experience. I developed my own strategy based on supply/demand levels and trend follow!
Motto: Take what you need and leave, don't look back! - Version: 1.30
- Aktualisiert: 3 November 2021
- Aktivierungen: 7
Unterschied zwischen einem Reversal und einem Pullback
Eine Umkehrung ist eine Trendwende im Preis eines Vermögenswerts. Ein Pullback ist eine Gegenbewegung innerhalb eines Trends, die den Trend nicht umkehrt. Ein Aufwärtstrend entsteht durch höhere Schwellenhochs und höhere Schwellentiefs. Pullbacks erzeugen die höheren Tiefststände. Daher tritt eine Umkehr des Aufwärtstrends erst dann ein, wenn der Kurs in dem Zeitrahmen, den der Händler beobachtet, ein niedrigeres Tief erreicht. Umkehrungen beginnen immer als potenzielle Pullbacks. Welcher es letztendlich sein wird, ist zu Beginn unbekannt.
Der Indikator gibt Ihnen Signale, wenn eine hohe Wahrscheinlichkeit für eine Umkehr besteht, aber in Wirklichkeit werden Sie einen Pullback handeln, bis er sich in einen Trend verwandelt.
Ist dieser Indikator rentabel?
Ja.
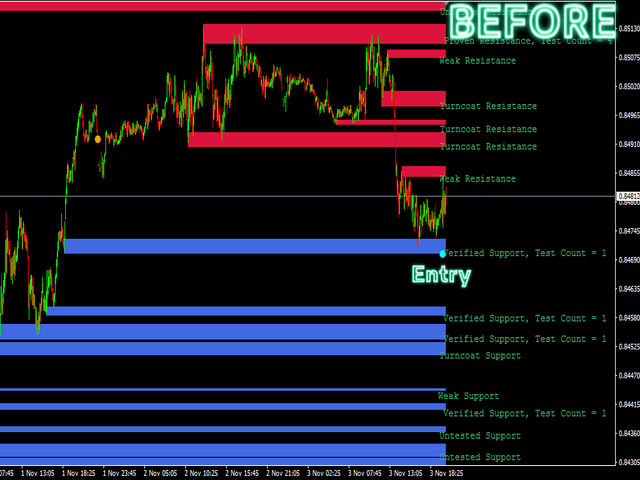
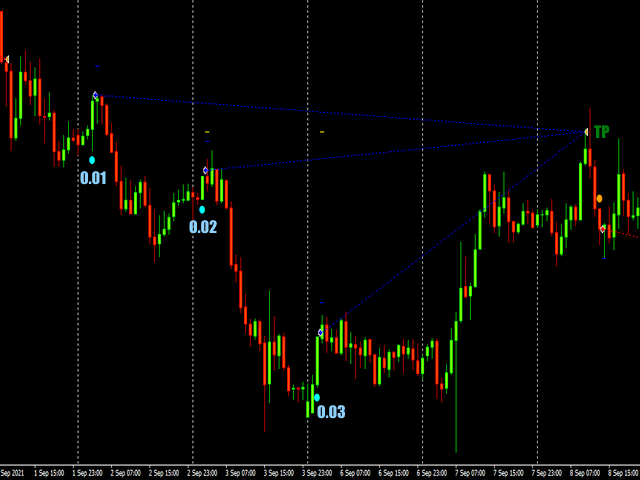
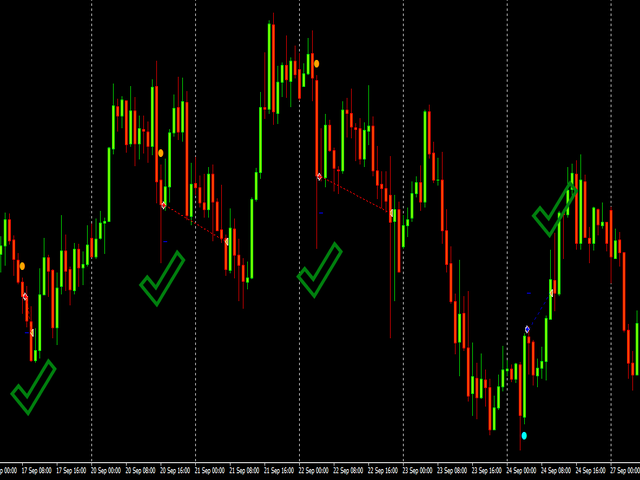
Siehe die Screenshots, um meine Strategie zu sehen.
Merkmale:
Scalping
Trend TF - M15
CalculateOnBarClose1 - 1
Trend1 - 100
Trend2 - 100
Entry TF - M15
Entry Period - 8
Trend
CalculateOnBarClose1 - 1
Trend1 - 950
Trend2 - 1350
Entry TF - H1
Einstiegszeitraum -21
Starker Trend
CalculateOnBarClose1 - 1
Trend1 - 950
Trend2 - 1350
Einstieg TF - H4
Einstiegszeitraum -21
Enable Alerts - true/false
Enable Push Notifications - true/false
Alert Delay (Candles) - 1
Enable Scalping Arrows/Alerts - true/false
Enable Trend Arrows/Alerts - true/false
Enable Strong Trend Arrows/Alerts - true/false
Abstand zwischen Signalen Scalping - 30
Abstand zwischen Signalen Trend - 50
Abstand zwischen Signalen Starker Trend - 100