• Información general
  • Comentarios
  • Discusión
  • Novedades

AIS Moving Pseudo Median

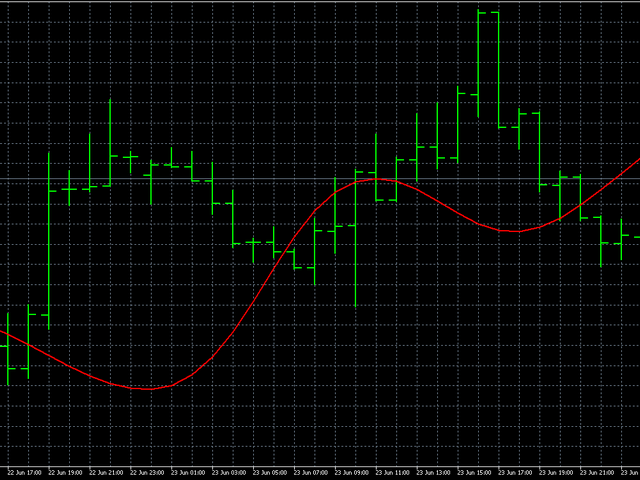
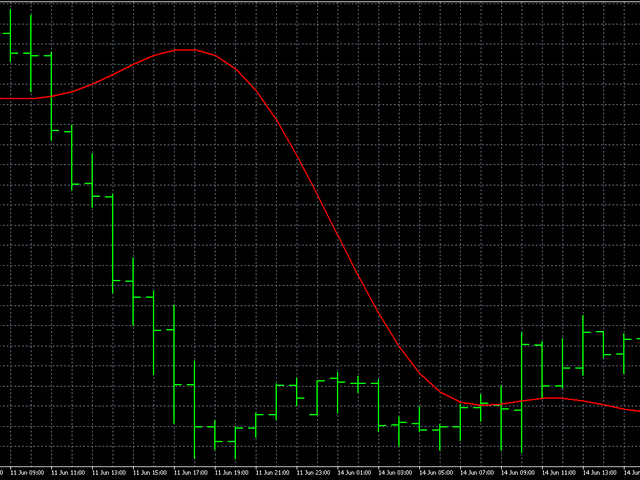
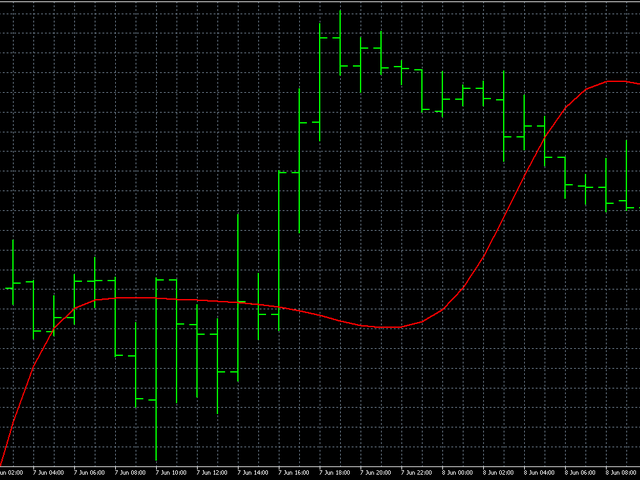
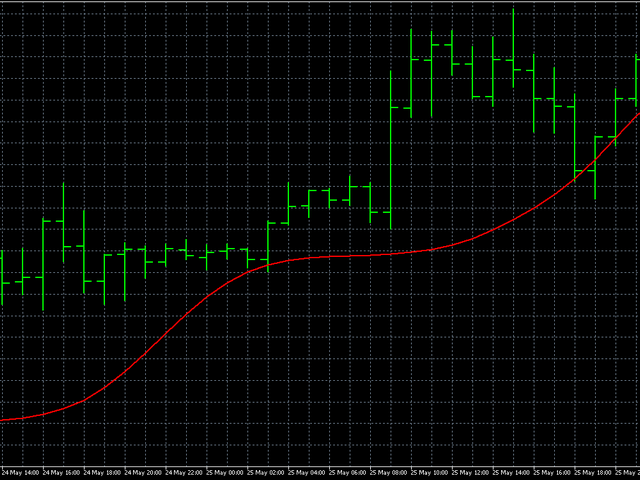
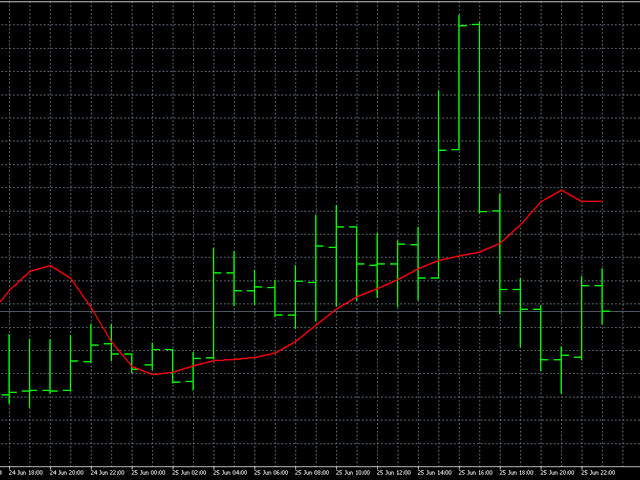
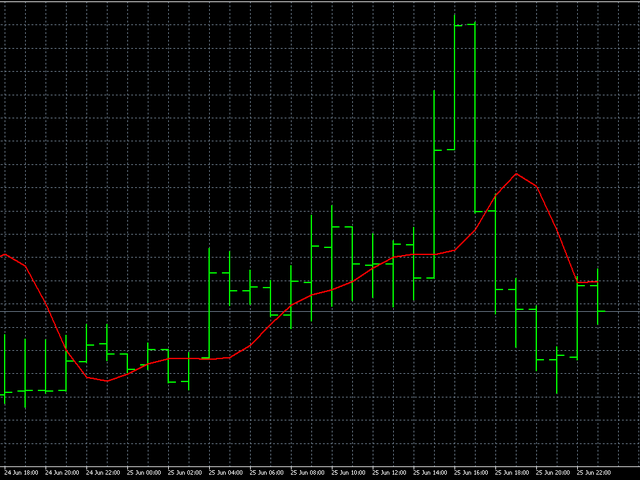
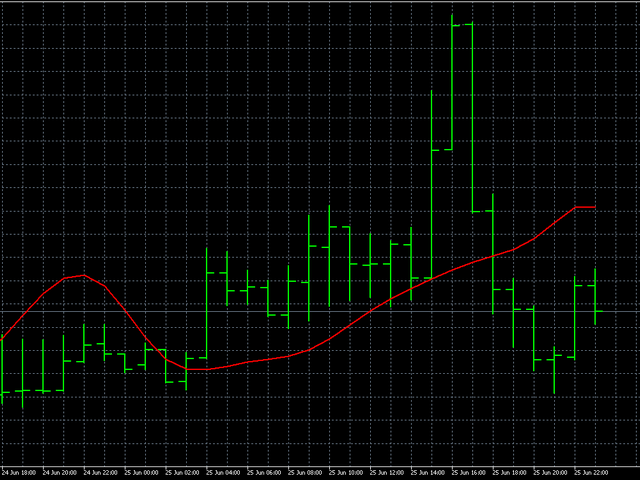
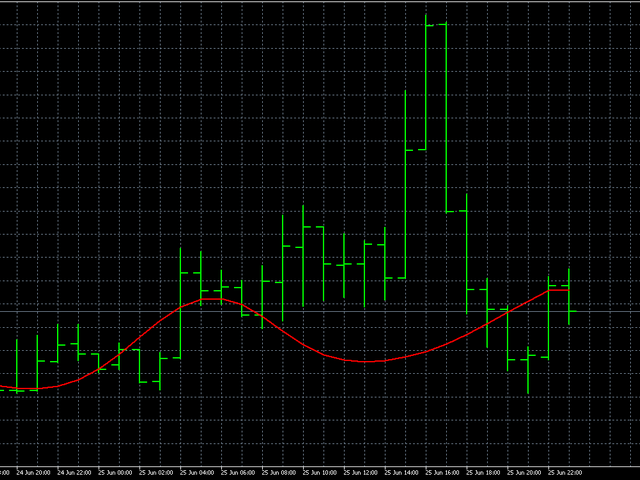
La media aritmética o la mediana se pueden utilizar para determinar la medida de la tendencia central de una serie de tiempo. Ambos métodos tienen algunas desventajas. La media aritmética se calcula mediante el indicador de media móvil simple. Es sensible a las emisiones y al ruido. La mediana se comporta de manera más estable, pero hay una pérdida de información en los límites del intervalo.

Para reducir estas desventajas, se puede utilizar un filtrado de señales pseudo-mediano. Para hacer esto, tome la mediana de una longitud pequeña y aplíquela recursivamente a todos los valores del período de la serie de tiempo financiera en estudio. Gracias a este enfoque, el indicador le permite identificar con mayor precisión los movimientos de precios periódicos y de tendencia.

Parámetros externos del indicador:

  • iPrice: constante de precio utilizada en los cálculos;
  • iPeriod - período indicador. Cuanto mayor sea el valor de este parámetro, menor será la sensibilidad del indicador a los últimos cambios de precio. El valor mínimo de este parámetro es 3;
  • MaxBars: limita la profundidad del historial para el cálculo. Puede resultar útil si el indicador tarda mucho en iniciarse. Si MaxBars = 0, entonces no hay restricciones y el indicador se aplicará a todo el gráfico.

    Productos recomendados
    BoB Osc AM
    Andriy Matviyevs'kyy
    This indicator displays in the form of an oscillator the difference between the maximum/minimum prices for the current period of time and the maximum/minimum price for a longer period. An increase in indicator values ​​above zero indicates that the maximum price for the current period is greater than the maximum price for the period selected as an indicator parameter. This situation in most cases indicates an increase in the value of the asset. A drop in indicator values ​​below zero indicates t
    FREE
    Automatically detect bullish or bearish order blocks to optimize your trade entries with our powerful indicator. Ideal for traders following ICT (The Inner Circle Trader). Works with any asset type, including cryptocurrencies, stocks, and forex. Displays order blocks on multiple timeframes, from M2 to W1. Alerts you when an order block is detected, migrated, or a higher timeframe order block is created/migrated. Perfect for both scalping and swing trading in Smart Money Concepts.  Enhanced by st
    Все трейдеры знают, что без статистики работать нельзя и ведут статистику на бумаге или используют интернет ресурсы. Индикатор "VG-Statistics" создает статистику по истории Ваших сделок. Для правильной работы нужно выбрать нужный период в истории сделок и нажать кнопку "Развернуть" в левом углу графика, по умолчанию будут подсчитаны все сделки загруженные в ваш терминал с учетом комиссии и свопа, для подсчета например только "EURUSD" установите индикатор на график "EURUSD" и в настройках изменит
    El indicador de media móvil R Var es un indicador de seguimiento de tendencias diseñado para seguidores de tendencias acérrimos. Es un indicador de compraventa de divisas bastante popular entre los comerciantes de acciones, así como entre los comerciantes de productos básicos, y su popularidad se debe a su capacidad para ofrecer señales genuinas de hacer dinero a sus usuarios. El indicador se compone de puntos verdes y rojos que se colocan en una línea de siena. El punto verde apunta a una
    ChristMyHedge (Christ My Hedge)  is an EA (Expert Advisor) aka forex trading robot based on Overbought/Oversold, trend-reversal/trend-confirmation principle. Recommended pairs are EURUSD, USDCHF, USDCAD, NZDUSD, USDJPY, AUDUSD, EURJPY, CADJPY, AUDJPY, EURGBP , EURCHF and GBPUSD .  This EA is the MT4 version and run on D1 (or Daily ) charts only. ( MT5 version is also here in the market ).  However, the newer version of ChristMyHedge-MT5 is news-based .i.e. it monitors economic news before openin
    Chart Local Time
    Rider Capital Group
    4.67 (18)
    Display your Local Time on your charts Display your local time   instead of (or along with) MT4 server time. Display crosshair   which highlights current candle time. Automatically adjusts based on chart zoom (zooming in or out). Displays on every timeframe (M1 – Month), and auto-adjusts as chart timeframe is changed. Handles special ½ hour time zones , such as India.  Renders   fast   (no lag) as you scroll charts. Customize the font family, font size, background color, and crossh
    Hello, My name is Callan May i am a forex teacher  from learn to trade with cal, over the past year i have made an expert advisor that is affordable and works extremely well,WILL IT MAKE YOU A MILLIONARE Over night... no but itll make consistant profits month in month out year in year out follow the settings.  it works on the usdchf and eurusd pairs only and the 1hour tf only the settings will change every 1000 dollars profit witch you will do manually, only the volume will change by 0.01 ev
    Top Gun Oscillators
    Safwan Rushdi Khalil Arekat
    5 (3)
    Note : New in 1.6: the indicator now exports the trade signal (but not displayed). Go long with light blue. Go short with red. Exit otherwise. Signal to be imported to your EA using iCustom. This indicator provides Best of the Best linear filter momentum oscillators that I am aware of (Low Pass Differentiators, LPD's) . All of them are  recent developments by this developer, or other researchers. The oscillator line is the first buffer of the indicator, and can be called  in other indicators or
    FREE
    This Indicator will notified you when time to entry into the market, build with double william percent range strategy.  --> Buy Notification will flag with the blue arrow --> Sell Notification will flag with the red arrow After Flag Appear, the market usually explode but carefully you must performs double check because weakness of this indicator when in the end of the trend
    CHF Portal is designed for Trading USDCHF specifically. Trading Concept The operation concept of CHF Portal is based on an algorithm which tries to determine the Trend. To be more specific, CHF Portal works with its own calculation logic according to historical volatility and price movement. It is trying to find out the Top or Bottom in a Trend, and open the Short or Long Position accordingly. Don't expect CHF Portal can be able to open the trade on the highest or lowest level, because CHF Por
    Aura Eclipse MT4
    Stanislav Tomilov
    5 (4)
    Aura Eclipse  is a fully automated EA designed to trade  currencies during evening and night hours .  It is based on machine learning deep neural network analysis and smart scalping  algorithms. The first multi-currency scalper uses deep machine learning mechanism - Keras. Its a deep learning API written in Python, running on top of the machine learning platform   Tensor Flow . It was developed with a focus on enabling fast experimentation.  Keras provides industry-strength performance and scala
    News Catcher Pro
    Valeriia Mishchenko
    4 (8)
    News Catcher Pro is a mean-reversion strategy that uses intraday seasonal volatility patterns caused by high-impact news events. It enters the market at a certain time shortly before a high-impact news event occurs . It does not trade frequently! Supported currency pairs: GBPUSD, EURUSD, EURGBP Recommended timeframe: M5 MT5 version can be found here EA is   FIFO compatible To backtest the EA you should download the news events data file ' NewsEvents.txt ' and copy it to the common MT4/5 dir
    MA Multi-Currencies  Multi-Timeframes Histogram BUY/SELL Indicator up to 6 currencies on time  calculations based on 6 time frames : M5, M15, M30, H1, H4, D1 Trading Strategies: **TREND shifts to UP trend when Green point appears after Red and Gray points -> Close SELL positions then add new BUY positions on new Green points  **TREND shifts to DOWN trend when Red point appears after Green and Gray points -> Close BUY  positions then add new SELL positions on new Red points ** Close BUY position
    A technical indicator that displays information about the trading volume in the form of a histogram of distribution by price levels. It is used as an independent indicator that helps to evaluate the current objective situation of the instrument, as well as in the format of integration with other methods of analysis, to confirm or filter when making trading decisions. Key Features: Interactive profile update, real-time work Five modes of histogram calculation The possibility of separating the vo
    Jerk Indicator
    Safwan Rushdi Khalil Arekat
    In physics, "Jerk" is the third time-derivative of position, with acceleration being the second derivative and velocity the first derivative. In technical analysis, the first derivative of price is the price momentum, with the second derivative,acceleration, being seldom used and the third derivative virtually unknown. The magnitude frequency response of a digital differentiator is a positive-slope straight line passing through zero frequency. Therefore, every instance of a digital signal differ
    FREE
    MT5 version   —   https://www.mql5.com/en/market/product/70988 With this indicator, you will be able to observe the relative price changes of other instruments on the current chart. Settings : refreshEveryTick  —   updates every tick. sym1 — The Name of the instrument. If empty or equal to "0", then it is ignored. numberOfIntervals —   number of intervals. i ndicatorMode — display mode. Sets the value of each interval:  by4h   (4 hours),  by6h  (6 hours), etc. Mode  byDeep   - the interval is eq
    GeoWprPro
    Georgij Komarov
    WPR by Profile, or WPR for Professionals Geo_WprPro is one of the well-known currency profile indicators. It simultaneously displays two WPR indicators with different parameters in the matrix form on all timeframes of multiple currency pairs forming the currency profile . As follows from the description, " WPR is a leading indicator that often goes ahead of the price chart. The oscillator frequently reaches extreme values before the price reversal as if anticipating that event: it almost always
    实盘交易盈利,回测年化125%,回撤25%,交易量少,不是经常下单,挂起后要有耐心。没有多牛的技术,只是一套简单的交易策略,贵在长期坚持,长期执行。我们有时候就是把自己高复杂,想想我们交易的历程,你就会发现,小白好赚钱,当你懂得越多的时候也是亏损的开始,总是今天用这个技术,明天用那个指标,到头来发现,没有一个指标适合你。其实每个技术指标都是概率性的,没有100%的胜率。很多技术指标你要融合一套交易策略,资金仓位控制,止损止盈比例,一套策略下来下一步你做的就是执行力了,必须要坚决执行你的交易策略,如果不能坚持的话最终还是在亏损。说实话不是每个人都有好的心态和执行力,所以我们做出来这款ea自己来用,发现时间久了扭亏为盈了,那现在就拿出来给大家分享,让更多的人来达到自己的盈利目标。购买后留下邮箱或添加软件里的qq,我们会根据你的资金来调整软件参数。 经测试过的柱数 14794 用于复盘的即时价数量 51321985 复盘模型的质量 n/a 输入图表错误 213935 起始资金 10000.00 点差 当前 (54) 总净盈利 12583.42 总获利 37630.02 总亏损 -25046.
    Extremums  and   Candles              1. Description The Extremums and Candles (EC) indicator is a custom indicator based on the visual analysis of candles. The indicator displays the direction of price movement and extremes for the studied period of time. The EC indicator is designed according to the principle that candles inside the next one or inside the previous one, regardless of their type and the length of their shadows, are not taken into account when determining the direction of marke
    Trade Stats
    Johannes Schoeman
    Does your trading consist of Multiple EA's, Multiple time frames an no clear indication of how each individual strategy or time frame is performing, then this indicator will help. Assign the EA Magic number to this indicator and track it's performance on the chart by selecting on chart the period, today, week, month year or all history to view. Easy visual colour changing header to display the performance of the EA for the respective periods.    Minimize the panel to reduce chart clutter. Add yo
    High Volume Turns
    Nesimeye Oswald
    4.7 (10)
    Most of the time, market reversals / pull backs usually follow volume and price spikes thus  these spikes could be the first indication of an exhaustion and possible reversal/pullback. High volume Turns is an indicator that scans the market for price and volume spikes around over-bought/over-sold market conditions. These spikes when spotted serves as the first indication of reversal/pullback. Note :  Though it seems ok now but this is a system that is still under development. We have made it p
    FREE
    The expert uses several strategies of pending and market orders for trading. You can setup fully-automated mode or semi-automated mode (you open the trade and the expert manages the rest) . Expert uses advanced trading algorithm with flexible risk management settings. The expert is applicable to all symbols and also works via the mobile app MT4 . --  General   settings  --  Magic   number   -  unique  ID  (number >=0) for expert transactions Lot   size  -  lot size Stop   Loss  (0- disable )
    Arbitrage-news trading EA. Works at a user-defined deviation from the price during the news release (optional). The trade is opened when the fast broker gets ahead of the slow one by the specified amount of points. The trades are opened by the direction of the fast broker price movement, works both during the news release and without the news filter. The news filter automatically determines the time zone and the currency the news is released on. To enable the news filter you need to do the follo
    RBCI hist
    Sergey Zhukov
    The RBCI hist indicator is an adaptive trend histogram, that eliminates noise using a Low-pass filter, which passes the lower frequencies and cuts off hight frequencies of the price fluctuations. The signal (depending on the strategy chosen by trader) is the intersection of the zero line by the indicator, as well as the change in the histogram color. The change in the histogram color serves as an early signal for opening positions towards the trend. The position of the indicator relative to the
    Indicador Forex "Histograma de entrada de tendencia" para MT4 El indicador de histograma de entrada de tendencia se puede utilizar para buscar señales de entrada en la dirección de la tendencia una vez que aparece la barra de entrada. Este indicador tiene una característica única: para los cálculos se necesitan tanto el precio como el volumen. El histograma de entrada de tendencia puede estar en 2 colores: rojo para una tendencia bajista y azul para una tendencia alcista. Una vez que vea una
    ToolBox 360 is the swiss knife of all indicators. It is full packed with useful tools to help you with your trading. It can be used to find best entry and exit points and help you to decide if you should open a trade or not. It shows market trends, candlestick formations outside / inside bars and you can sett time based allerts. Main features: Time based Fibonacci lines Choose a start and end time and the indicator shows you Fibonacci lines within the selected time range including range high
    Edward Teach Fx Это советник для краткосрочной торговли с использованием серии ордеров с их усреднением  и последующим увеличением. Советник торгует в обе стороны, выбирая более подходящую сторону в процессе торговли. Используется скрытые профиты и виртуальный скользящий стоп в виде трала.Так же советник имеет возможность останавливать торговлю (не открывать новые ордера) перед важными новостями, как   при ручной установке, так и получая информацию от индикатора "News provider" . Имеется несколь
    MQLTA Candle Timer
    MQL4 Trading Automation
    5 (1)
    MQLTA Candle Timer is an indicator that can show you the details about a symbol/pair and alert you before the close of a candle. Used in swing trading and not only, it can help your strategies knowing and be ready before the close of a candle. How does it work Simply add the indicator to the chart and set the notifications options. You can load a minimalistic interface or a full interface. The alert will be sent once per candle. Parameters All the parameters, that you can see in the picture,
    FREE
    Trend Oracle trend indicator, shows entry signals. Displays both entry points and the trend itself. Shows statistically calculated moments for entering the market with arrows. When using the indicator, it is possible to optimally distribute the risk coefficient. The indicator can be used for both short-term pipsing and long-term trading. Uses all one parameter for settings. Length - the number of bars to calculate the indicator. When choosing a parameter, it is necessary to visually similarize s
    Praetor EA   PRAETOR   is a moderately secure trading system based on a clustering model of trading patterns. It consists of many simple functions and has many parameters that allow you to memorize various market situations and interpret them correctly. The advisor opens one deal in a certain direction and places       Stop Loss       and       Take Profit   , and when a certain profit is reached, the advisor uses       Trailing Stop   . The signals of the model are based on such indicators as
    Los compradores de este producto también adquieren
    Gann Made Easy
    Oleg Rodin
    4.96 (47)
    Gann Made Easy es un sistema de comercio de Forex profesional y fácil de usar que se basa en los mejores principios de comercio utilizando la teoría del Sr. W. D. Gann. El indicador proporciona señales precisas de COMPRA y VENTA, incluidos los niveles de Stop Loss y Take Profit. Puede comerciar incluso sobre la marcha utilizando notificaciones PUSH. ¡Por favor, póngase en contacto conmigo después de la compra! ¡Compartiré mis consejos comerciales con usted y excelentes indicadores de bonificació
    Atomic Analyst
    Issam Kassas
    5 (2)
    En primer lugar, vale la pena enfatizar que este Indicador de Trading no repinta, no redibuja y no se retrasa, lo que lo hace ideal tanto para el trading manual como para el automatizado. El Analista Atómico es un Indicador de Acción del Precio PA que utiliza la fuerza y el impulso del precio para encontrar una mejor ventaja en el mercado. Equipado con filtros avanzados que ayudan a eliminar ruidos y señales falsas, y aumentan el potencial de trading. Utilizando múltiples capas de indicadores
    TPSproTREND PrO
    Roman Podpora
    5 (15)
    TPSpro TRENDPRO  - is a trend indicator that automatically analyzes the market and provides information about the trend and each of its changes, as well as giving signals for entering trades without redrawing! The indicator uses each candle, analyzing them separately. referring to different impulses - up or down impulse. Exact entry points into transactions for currencies, crypto, metals, stocks, indices!  -  Version MT5               DETAILED DESCRIPTION        /       TRADING SETUPS           
    ACTUALMENTE 26% DE DESCUENTO ¡La mejor solución para cualquier operador novato o experto! Este indicador es una herramienta única, de alta calidad y asequible porque hemos incorporado una serie de características propias y una nueva fórmula. ¡Con sólo UN gráfico puede leer la Fuerza de la Divisa para 28 pares de Divisas! Imagínese cómo mejorará su operativa porque podrá señalar el punto exacto de activación de una nueva tendencia o de una oportunidad de scalping. Manual del usuario: haga
    Scalper Vault
    Oleg Rodin
    5 (27)
    Scalper Vault es un sistema profesional de reventa que le brinda todo lo que necesita para una reventa exitosa. Este indicador es un sistema comercial completo que puede ser utilizado por operadores de divisas y opciones binarias. El marco de tiempo recomendado es M5. El sistema le proporciona señales de flecha precisas en la dirección de la tendencia. También le proporciona señales superiores e inferiores y niveles de mercado de Gann. Los indicadores proporcionan todo tipo de alertas, incluidas
    Ante todo, vale la pena enfatizar que esta Herramienta de Trading es un Indicador No Repintado, No Redibujado y No Retrasado, lo que la hace ideal para el trading profesional. El Indicador de Conceptos de Acción del Precio Inteligente es una herramienta muy potente tanto para traders nuevos como experimentados. Combina más de 20 indicadores útiles en uno solo, combinando ideas avanzadas de trading como el Análisis del Trader del Círculo Interior y Estrategias de Trading de Conceptos de Dinero
    ¡Actualmente 20% OFF ! ¡La mejor solución para cualquier novato o trader experto! Este software funciona con 28 pares de divisas. Se basa en 2 de nuestros principales indicadores (Advanced Currency Strength 28 y Advanced Currency Impulse). Proporciona una gran visión general de todo el mercado de divisas. Muestra los valores de Advanced Currency Strength, la velocidad de movimiento de las divisas y las señales para 28 pares de divisas en todos los (9) marcos temporales. Imagine cómo mejorar
    Scalper Inside PRO
    Alexey Minkov
    4.75 (55)
    SALE NOW! Limited Time Offer! An exclusive indicator that utilizes an innovative algorithm to swiftly and accurately determine the market trend. The indicator automatically calculates opening, closing, and profit levels, providing detailed trading statistics. With these features, you can choose the most appropriate trading instrument for the current market conditions. Additionally, you can easily integrate your own arrow indicators into Scalper Inside Pro to quickly evaluate their statistics and
    TPSpro RFI Levels
    Roman Podpora
    5 (13)
    A key element in trading is zones or levels from which decisions to buy or sell a trading instrument are made. Despite attempts by major players to conceal their presence in the market, they inevitably leave traces. Our task was to learn how to identify these traces and interpret them correctly. Reversal First Impulse levels (RFI)   -  Version MT5                INSTRUCTIONS                 RUS                 ENG                                       R ecommended to use with an indicator   -  
    Introduciendo       Indicador Quantum Trend Sniper   , el innovador indicador MQL5 que está transformando la forma en que identificas y negocias los cambios de tendencia. Desarrollado por un equipo de comerciantes experimentados con experiencia comercial de más de 13 años,       Indicador de francotirador de tendencia cuántica       está diseñado para impulsar su viaje comercial a nuevas alturas con su forma innovadora de identificar cambios de tendencia con una precisión extremadamente alta.
    Conviértase en un Breaker Trader y obtenga beneficios de los cambios en la estructura del mercado a medida que se invierte el precio. El indicador de ruptura de bloque de órdenes identifica cuándo una tendencia o movimiento de precio se acerca al agotamiento y está listo para revertirse. Le alerta sobre cambios en la estructura del mercado que generalmente ocurren cuando una reversión o un retroceso importante están a punto de suceder. El indicador utiliza un cálculo patentado que identific
    Trend Screener
    STE S.S.COMPANY
    4.83 (86)
    Indicador de tendencia, solución única e innovadora para el comercio y filtrado de tendencias con todas las funciones de tendencias importantes integradas en una sola herramienta. Es un indicador 100% sin repintar de marcos temporales y monedas múltiples que se puede usar en todos los símbolos/instrumentos: divisas, materias primas, criptomonedas, índices y acciones. Trend Screener es un indicador de seguimiento de tendencia eficiente que proporciona señales de tendencia de flecha con puntos en
    Quantum Breakout Indicator PRO
    Bogdan Ion Puscasu
    4.96 (26)
    Introduciendo       Quantum Breakout PRO   , el innovador indicador MQL5 que está transformando la forma en que comercia con Breakout Zones. Desarrollado por un equipo de operadores experimentados con experiencia comercial de más de 13 años,   Quantum Breakout PRO   está diseñado para impulsar su viaje comercial a nuevas alturas con su innovadora y dinámica estrategia de zona de ruptura. El indicador de ruptura cuántica le dará flechas de señal en las zonas de ruptura con 5 zonas objetivo de
    Advanced Supply Demand
    Bernhard Schweigert
    4.92 (310)
    ¡Actualmente con 33% de descuento! ¡La mejor solución para cualquier tráder principiante o experto! Este indicador es una herramienta comercial única, de alta calidad y asequible, porque incorpora una serie de características patentadas y una nueva fórmula. Con esta actualización, podrá mostrar zonas de doble marco temporal. No solo podrá mostrar un marco temporal más alto, sino también mostrar ambos, el marco temporal del gráfico MÁS el marco temporal más alto: MOSTRANDO ZONAS ANIDADAS. A todos
    Currency Strength Wizard es un indicador muy poderoso que le proporciona una solución todo en uno para operar con éxito. El indicador calcula el poder de este o aquel par de divisas utilizando los datos de todas las monedas en múltiples marcos de tiempo. Estos datos se representan en forma de índice de moneda fácil de usar y líneas eléctricas de moneda que puede usar para ver el poder de esta o aquella moneda. Todo lo que necesita es adjuntar el indicador al gráfico que desea operar y el indicad
    ¡Descubra el secreto para el comercio de Forex exitoso con nuestro indicador MT4 personalizado! ¿Alguna vez se ha preguntado cómo lograr el éxito en el mercado de Forex, obteniendo ganancias constantemente al tiempo que minimiza el riesgo? ¡Aquí está la respuesta que ha estado buscando! Permítanos presentar nuestro indicador MT4 patentado que revolucionará su enfoque para el comercio. Versatilidad única Nuestro indicador está especialmente diseñado para usuarios que prefieren las formacio
    Break and Retest
    Mohamed Hassan
    5 (4)
    Break & Retest is unstoppable when combined with our other divergence indicator. After purchase, send us a message and you could get this  2nd indicator  for  FREE  as a  BONUS! ‍You can visually backtest Break & Retest to see how it behaved in the past!    Manual guide:   Click here $59  for the first 25 copies ( 1  left)! Next price is $120 .  This Indicator only places quality trades when the market is really in your favor with a clear break and retest. Patience is key
    Presentamos el Indicador Milagroso de Forex: Desata el Poder del Trading Preciso ¿Estás cansado de buscar el mejor indicador de Forex que realmente ofrezca resultados excepcionales en todos los marcos temporales? ¡No busques más! Ha llegado el Indicador Milagroso de Forex para revolucionar tu experiencia de trading y llevar tus ganancias a nuevas alturas. Construido sobre una base de tecnología de vanguardia y años de desarrollo meticuloso, el Indicador Milagroso de Forex se erige como el pinácu
    Entry Points Pro
    Yury Orlov
    4.7 (225)
    Este es un genial indicador para MT4 que ofrece señales precisas para entrar en una transacción sin redibujar. Se puede aplicar a cualquier activo financiero: fórex, criptomonedas, metales, acciones, índices. Nos dará valoraciones bastante precisas y nos dirá cuándo es mejor abrir y cerra una transacción. Eche un vistazo  al vídeo  (6:22), ¡contiene un ejemplo de procesamiento de una sola señal que ha amortizado el indicador! La mayoría de los tráders mejoran sus resultados comerciales durante l
    TrendDecoder Premium
    Christophe, Pa Trouillas
    5 (3)
    Identifique los rangos y los próximos movimientos probables   |  Obtenga las señales más tempranas y la fuerza de las Tendencias   |  Obtener salidas claras antes de reversión   |  Detecte los niveles de Fibo que el precio pondrá a prueba Indicador no repintado y no retardado - ideal para la trading manual y automatizada - adecuado para todos los activos y todas las unidades temporales Oferta por tiempo limitado >>   50% OFF Después de la compra, póngase en contacto con mi canal  para conocer lo
    ALERTA DE COMPRA Y VENTA MULTIDIVISA y MULTITIMEFRAME. ¡STOP DE TRAILING AUTOMÁTICO Y TOMA DE BENEFICIOS DE RECOMPENSA DE RIESGO! ¡EL INDICADOR ESCANEA Y ANALIZA EL MERCADO PARA QUE NO TENGAS NADA QUE HACER! ¡COMERCIA TODAS TUS MONEDAS EN 1 GRÁFICO!   Después de la compra, deje un comentario, contácteme y le enviaré el asistente comercial EA. El indicador utiliza varios osciladores y filtros adjuntos para encontrar los mejores puntos de entrada CONFIRMADOS, ¡así que no necesita preocupars
    TrendMaestro
    Stefano Frisetti
    5 (2)
    note: this indicator is for METATRADER4, if you want the version for METATRADER5 this is the link: TRENDMAESTRO recognizes a new TREND in the bud, he never makes mistakes. The certainty of identifying a new TREND is priceless. DESCRIPTION TRENDMAESTRO identifies a new TREND in the bud, this indicator examines the volatility, volumes and momentum to identify the moment in which there is an explosion of one or more of these data and therefore the moment in which prices have strong probability of f
    FX Volume
    Daniel Stein
    4.6 (35)
    Obtenga su actualización diaria del mercado con detalles y capturas de pantalla a través de nuestro Morning Briefing aquí en mql5 y en Telegram ! FX Volume es el PRIMER y ÚNICO indicador de volumen que proporciona una visión REAL del sentimiento del mercado desde el punto de vista de un bróker. Proporciona una visión impresionante de cómo los participantes institucionales del mercado, como los brokers, están posicionados en el mercado Forex, mucho más rápido que los informes COT. Ver esta info
    Price Action Entry Alerts
    Stephen Sanjeeve Sahayam
    5 (3)
    Este indicador analiza cada barra en busca de presión de compra o venta e identifica 4 tipos de patrones de velas con el volumen más alto. Estas velas luego se filtran utilizando varios filtros lineales para mostrar señales de compra o venta. Las señales funcionan mejor, junto con una dirección de marco de tiempo más alta y cuando se negocian durante horas de alto volumen. Todos los filtros son personalizables y funcionan de forma independiente. Puede ver señales de una sola dirección con el cli
    ACTUALMENTE 31% DE DESCUENTO Este indicador es una herramienta de transacción única, de alta calidad y asequible porque hemos incorporado una serie de características propias y una fórmula secreta. Con solo un gráfico, da Alertas para los 28 pares de divisas. ¡Imagina cómo mejorarás porque puedes identificar el punto de activación exacto de una nueva tendencia u oportunidad de crecimiento! Basado en nuevos algoritmos subyacentes , hace que sea aún más fácil identificar y confirmar operaciones po
    Trend Forecasting
    Mohamed Hassan
    5 (15)
    This indicator is unstoppable when combined with our other indicator called Katana. After purchase, send us a message and you could get Katana for FREE as a BONUS After purchase, send us a private message for your instructions.  MT5 version: click here 3 copies left available at $45. Next price is $99. Don't miss this great deal!  The Trend Forecasting indicator is a very unique & easy tool that is able to make prediction about future price movement based on the signals generated
    Dibuja automáticamente los niveles de soporte y resistencia MÁS los gaps de las velas de propulsión en su gráfico, para que pueda ver hacia dónde es probable que el precio se dirija a continuación y/o potencialmente retroceda. Este indicador está diseñado para ser utilizado como parte de la metodología de negociación de posiciones que se enseña en mi sitio web (The Market Structure Trader) y muestra información clave para la orientación y entradas potenciales. Hay 2 características PRINCIPA
    How to use Pair Trading Station Pair Trading Station is recommended for H1 time frame and you can use it for any currency pairs. To generate buy and sell signal, follow few steps below to apply Pair Trading Station to your MetaTrader terminal. When you load Pair Trading Station on your chart, Pair Trading station will assess available historical data in your MetaTrader platforms for each currency pair. On your chart, the amount of historical data available will be displayed for each currency pai
    FX Power MT4 NG
    Daniel Stein
    5 (8)
    Obtenga su actualización diaria del mercado con detalles y capturas de pantalla a través de nuestro Morning Briefing aquí en mql5 y en Telegram ! FX Power MT4 NG es la nueva generación de nuestro popular medidor de fuerza de divisas, FX Power. ¿Y qué ofrece este medidor de fuerza de nueva generación? Todo lo que le encantaba del FX Power original PLUS Análisis de fuerza de ORO/XAU Resultados de cálculo aún más precisos Períodos de análisis configurables individualmente Límite de cálculo persona
    El sistema PRO Renko es un sistema de trading de alta precisión especialmente diseñado para operar gráficos RENKO. Se trata de un sistema universal que se puede aplicar a diversos instrumentos de negociación. El sistema neutraliza eficazmente el llamado ruido de mercado, lo que le brinda acceso a señales de reversión precisas. El indicador es muy fácil de usar y solo tiene un parámetro responsable de la generación de señales. Puede adaptar fácilmente la herramienta a cualquier instrumento com
    Otros productos de este autor
    This script allows selecting the TakeProfit and StopLoss levels. It analyzes the history data, and then calculates the probability of reaching a given price level. How the script works Suppose you have a trading strategy and you want to select the TakeProfit and StopLoss levels. Run the script and set the parameter: Number of Bars - the average position holding time in bars. Once the script operation is complete, the AIS-PPL.csv file will be created in the Files folder in the terminal data cat
    FREE
    AIS Money Management MT5
    Aleksej Poljakov
    5 (1)
    El script se basa en la simulación de transacciones comerciales utilizando un generador de números aleatorios. Esto le permite obtener resultados completamente diferentes, incluso con los mismos parámetros de entrada. Cuando ejecuta el script, se abre un cuadro de diálogo en el que puede establecer los valores deseados para las variables externas. En el bloque,   TradingOptions   define los parámetros básicos que se necesitan para simular el comercio. StartBalance : establece el tamaño inicial
    FREE
    MinDeposit MT5
    Aleksej Poljakov
    3 (1)
    The script analyzes the history of quotes and gives recommendations on the minimum deposit. The calculations take into account the variability of prices and the standard deviation. Margin requirements for the instrument are also taken into account. The result of the script is the minimum recommended deposit for trading the given currency pair.
    FREE
    The script allows selecting the required 'Filter level' value of the AIS-MTF MT5 indicator. Run the script on the required chart and selected timeframe. Once its operation is complete, the HPS.csv file will be created in the Files folder. Open the file. You will see three columns. The 'Filter lvl' column represents the value of the 'Filter level' for the AIS-MTF indicator. Am. dev. - degree and direction of the indicator's deviation from the price level (sorted in ascending order). Negative valu
    FREE
    El script se basa en la simulación de transacciones comerciales utilizando un generador de números aleatorios. Esto le permite obtener resultados completamente diferentes, incluso con los mismos parámetros de entrada. Cuando ejecuta el script, se abre un cuadro de diálogo en el que puede establecer los valores deseados para las variables externas. En el bloque, TradingOptions define los parámetros básicos que se necesitan para simular el comercio. StartBalance : establece el tamaño inicial de l
    FREE
    La elección de los niveles de StopLoss y TakeProfit puede tener un impacto muy fuerte en el rendimiento general de las operaciones. Además de los parámetros obvios de una transacción comercial (el tamaño de una posible ganancia o pérdida probable), los niveles de StopLoss y TakeProfit también afectan la duración esperada de la transacción y la rentabilidad de la negociación en general. Si ya ha determinado la duración óptima de la transacción utilizando el script " AIS-ODT ", entonces puede come
    FREE
    Este script está diseñado para que el comerciante pueda determinar la duración promedio de las transacciones comerciales, en la cual la relación de posibles ganancias y pérdidas será óptima. Primero, veamos el enfoque general para determinar la duración óptima de las transacciones comerciales. Introducimos las siguientes variables: R   - el resultado de la transacción; T   - el tiempo durante el cual la transacción estuvo abierta; W : el tiempo entre el cierre de la transacción anterior y la ape
    FREE
    MinDeposit
    Aleksej Poljakov
    5 (1)
    The script analyzes the history of quotes and gives recommendations on the minimum deposit. The calculations take into account the variability of prices and the standard deviation. Margin requirements for the instrument are also taken into account. The result of the script is the minimum recommended deposit for trading the given currency pair.
    FREE
    La elección de los niveles de StopLoss y TakeProfit puede tener un impacto muy fuerte en el rendimiento general de las operaciones. Además de los parámetros obvios de una transacción comercial (el tamaño de una posible ganancia o pérdida probable), los niveles de StopLoss y TakeProfit también afectan la duración esperada de la transacción y la rentabilidad de la negociación en general. Si ya ha determinado la duración óptima de la transacción utilizando el script " AIS-ODT ", entonces puede come
    FREE
    Este script está diseñado para que el comerciante pueda determinar la duración promedio de las transacciones comerciales, en la cual la relación de posibles ganancias y pérdidas será óptima. Primero, veamos el enfoque general para determinar la duración óptima de las transacciones comerciales. Introducimos las siguientes variables: R - el resultado de la transacción; T - el tiempo durante el cual la transacción estuvo abierta; W : el tiempo entre el cierre de la transacción anterior y la apertur
    FREE
    The script allows selecting the required 'Filter level' value of the AIS-MTF indicator. Run the script on the required chart and selected timeframe. Once its operation is complete, the HPS.csv file will be created in the Files folder. Open the file. You will see three columns. The 'Filter lvl' column represents the value of the 'Filter level' for the AIS-MTF indicator. Am. dev. - degree and direction of the indicator's deviation from the price level (sorted in ascending order). Negative values i
    FREE
    This script allows selecting the TakeProfit and StopLoss levels. It analyzes the history data, and then calculates the probability of reaching a given price level. How the script works Suppose you have a trading strategy and you want to select the TakeProfit and StopLoss levels. Run the script and set the parameter: Number of Bars - the average position holding time in bars. Once the script operation is complete, the AIS-PPL.csv file will be created in the Files folder in the terminal data cat
    FREE
    El indicador de promedios correctos de AIS le permite establecer el comienzo de un movimiento de tendencia en el mercado. Otra cualidad importante del indicador es una clara señal del final de la tendencia. El indicador no se redibuja ni se recalcula. Valores mostrados h_AE - límite superior del canal AE l_AE - límite inferior del canal AE h_EC - Valor predicho alto para la barra actual l_EC - Valor predicho bajo para la barra actual Señales al trabajar con el indicador. La señal prin
    El indicador de promedio móvil ponderado AIS calcula un promedio móvil ponderado y le permite determinar el comienzo de un movimiento de tendencia del mercado. Los coeficientes de peso se calculan teniendo en cuenta las características específicas de cada barra. Esto le permite filtrar los movimientos aleatorios del mercado. La señal principal que confirma el comienzo de una tendencia es un cambio en la dirección de las líneas del indicador y el precio que cruza las líneas del indicador.
    El indicador de factibilidad de grado avanzado de AIS está diseñado para predecir los niveles que el precio puede alcanzar en el futuro. Su trabajo es analizar las últimas tres barras y construir un pronóstico basado en eso. El indicador se puede utilizar en cualquier período de tiempo y cualquier par de divisas. Con la ayuda de la configuración, puede lograr la calidad deseada del pronóstico. Profundidad de pronóstico: establece la profundidad de pronóstico deseada en barras. Se recomienda s
    The indicator is designed to measure the price volatility. This allows determining the moments for opening or closing trade positions more accurately. High intensity of the market indicates the instability of its movement, but allows for better results. And, conversely, low intensity of the market indicates the stability of its movement. Parameters Bars to process - the number of bars to measure the price movements. A low value of this parameter allows determining the moments of rapid price mo
    This indicator uses the Fibonacci p-numbers to smooth a price series. This allows combining the advantages of the simple and exponential moving averages. The smoothing coefficients depend on the level of the p-number, which is set in the indicator parameters. The higher the level, the greater the influence of the simple moving average and the less significant the exponential moving average. Parameters Fibonacci Numbers Order - order of the Fibonacci p-number, specified by trader. Valid values
    The indicator is based on the analysis of interaction of two filters. The first filter is the popular Moving Average. It helps to identify linear price movements and to smooth minor price fluctuations. The second filter is the Sliding Median. It is a non-linear filter. It allows to filter out noise and single spikes in the price movement. A predictive filter implemented in this indicator is based on the difference between these filters. The indicator is trained during operation and is therefore
    This indicator studies the price action as a combination of micro-trends. All micro-trends are analyzed and averaged. Price movement is filtered based on this averaging. IP_High and IP_Low (blue and red dashed lines) show the instantaneous price movement. They display the forecast only for the current price values, taking into account only the number of bars defined by the 'Filter level' parameter. SP_High and SP_Low (blue and red solid lines) smooth the price movements with respect to history.
    Este indicador implementa un proceso de suavizado lineal simple. Una de las desventajas del suavizado exponencial es el rápido decaimiento de la señal. Esto hace que sea imposible realizar un seguimiento completo de las tendencias a largo plazo en el rango de precios. El suavizado lineal le permite ajustar con mayor precisión y precisión el filtrado de la señal. El indicador se configura seleccionando parámetros: LP: este parámetro le permite seleccionar el período de suavizado. Cuanto ma
    Este indicador es un filtro híbrido secuencial basado en una combinación de propiedades medias y medias móviles. El uso de la mediana permite filtrar valores atípicos anormales e impulsos aleatorios en los valores de las series de precios. Al mismo tiempo, el filtro de mediana no actúa sobre la tendencia en el movimiento de precios, dejándolo sin cambios. Como el filtro de la mediana no es lineal, se utiliza el promedio utilizando un promedio móvil simple para suavizar sus valores. Este enfoq
    Este indicador es una combinación de dos filtros modificados de Lanczos. El primer filtro sirve para extrapolar el precio. Basado en valores pasados, predice un posible movimiento de precios dentro de la barra actual. Es decir, muestra cuál sería el precio si las tendencias pasadas permanecieran sin cambios. El segundo filtro para suavizar y promediar los precios dentro de la ventana, determinado por el nivel del filtro. Gracias a la selección de ponderaciones, este filtro responde más activamen
    Echemos un vistazo a la naturaleza de los cambios de precios en el mercado de divisas, sin prestar atención a las razones por las que se producen estos cambios. Este enfoque nos permitirá identificar los principales factores que afectan el movimiento de precios. Por ejemplo, tomemos los precios de apertura de las barras en el par de divisas EUR-USD y el período H1. Para estos precios, construimos el diagrama de Lameray (Figura 1). En este diagrama, se puede ver que el movimiento del precio se pr
    Este indicador es más informativo. Su trabajo se basa en la suposición de que el movimiento de los precios en el mercado puede representarse como el ruido de un color en particular, que depende de los parámetros de la distribución de los valores de los precios. Gracias a esto, es posible analizar el cambio de precio desde diferentes ángulos y, considerando el movimiento del precio como ruido de un color en particular, se puede obtener información sobre el estado actual de las cosas en el mercad
    A pesar de algunos inconvenientes del indicador " AIS Color Noise Filter ", la idea de usarlo para suavizar las series de precios y los precios de previsión parece bastante atractiva. Esto se debe a varias razones: En primer lugar, tener en cuenta varios componentes de ruido permite elaborar un pronóstico sobre factores independientes entre sí, lo que puede mejorar la calidad del pronóstico; en segundo lugar, las características de ruido de las series de precios se comportan de manera bastante
    Muy a menudo, en el estudio de series financieras se aplica su suavizado. Mediante el suavizado, puede eliminar componentes de alta frecuencia; se cree que están causados ​​por factores aleatorios y, por lo tanto, no son significativos. El suavizado siempre incluye alguna forma de promediar los datos, en la que los cambios aleatorios en las series de tiempo se absorben mutuamente. Muy a menudo, para este propósito, se utilizan métodos de media móvil simple o ponderada, así como el suavizado exp
    Para aislar componentes a largo plazo y no aleatorios, es necesario saber no solo cuánto ha cambiado el precio, sino también cómo se produjeron estos cambios. En otras palabras, estamos interesados ​​no solo en los valores de los niveles de precios, sino también en el orden en que estos niveles se reemplazan entre sí. A través de este enfoque, se pueden encontrar factores a largo plazo y estables que influyen (o pueden influir) en el cambio de precio en un momento dado. Y el conocimiento de est
    Uno de los poderosos métodos de análisis es el modelado de series financieras utilizando procesos de Levy. La principal ventaja de estos procesos es que pueden usarse para modelar una gran cantidad de fenómenos, desde los más simples hasta los más complejos. Basta con decir que la idea del movimiento de los precios fractales en el mercado es solo un caso especial de los procesos de Levy. Por otro lado, con la selección adecuada de los parámetros, cualquier proceso de Levy puede representarse co
    Muy a menudo, el comerciante se enfrenta a la tarea de determinar en qué medida el precio puede cambiar en un futuro próximo. Para este propósito, puede usar el tipo de distribución Johnson SB. La principal ventaja de esta distribución es que puede usarse incluso con una pequeña cantidad de datos acumulados. El enfoque empírico utilizado para determinar los parámetros de esta distribución le permite determinar con precisión los niveles máximos y mínimos del canal de precios. Estos valores se pu
    Este indicador le permite determinar la probabilidad de que el precio alcance uno u otro nivel. Su algoritmo es bastante simple y se basa en el uso de datos estadísticos sobre los niveles de precios de un par de divisas en particular. Gracias a los datos históricos recopilados, es posible determinar en qué medida cambiará el precio durante la barra actual. A pesar de su simplicidad, este indicador puede proporcionar asistencia invaluable en el comercio. Entonces, con su ayuda, es posible determ
    Filtro:
    No hay comentarios
    Respuesta al comentario
    Versión 2.0 2022.10.20
    Оптимизированы расчеты