Points Ticks CCI MT4
- Indicadores
- Versión: 1.8
- Actualizado: 24 abril 2020
- Activaciones: 5

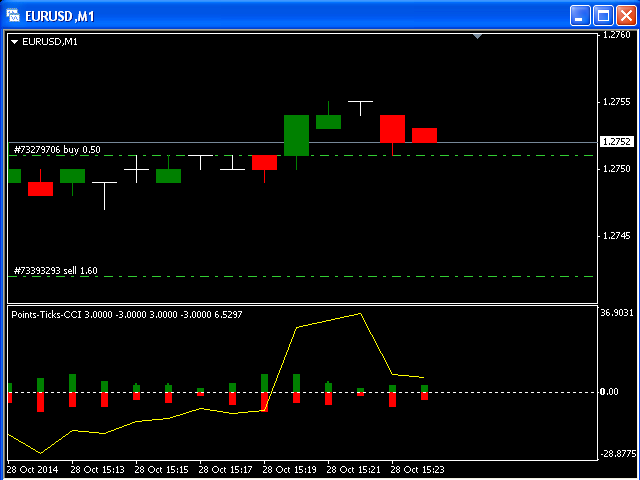
Este indicador está diseñado para el marco de tiempo M1 y muestra:
- Suma de ticks cuando el precio sube (color Verde -El componente principal de una vela = el cuerpo).
- Suma de puntos cuando el precio sube (color Verde - Las líneas de extensión en la parte superior de la vela).
- Suma de puntos cuando el precio baja (color Rojo -El componente principal de una vela = el cuerpo).
- Suma de puntos cuando el precio baja (color Rojo -Las líneas de extensión en el extremo inferior de la vela).
- Además se añade el indicador clásico Commodity Channel Index como línea de señal (color Amarillo).
El indicador comenzará a mostrar velas y líneas CCI desde la Barra actual. Debe esperar un par de minutos para ver este indicador en acción.