Points Ticks CCI MT4
- Indikatoren
- Version: 1.8
- Aktualisiert: 24 April 2020
- Aktivierungen: 5

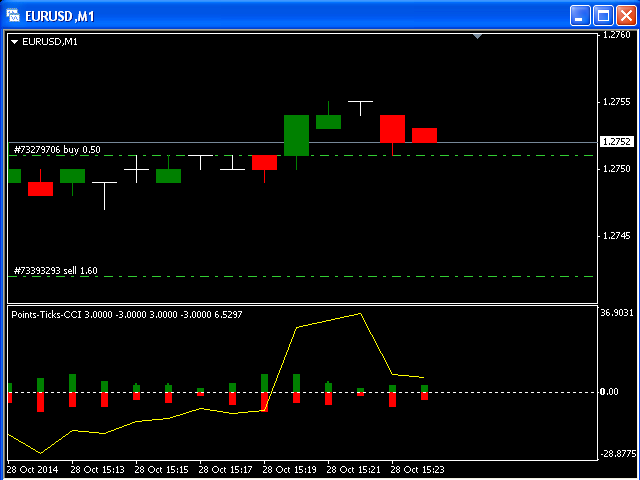
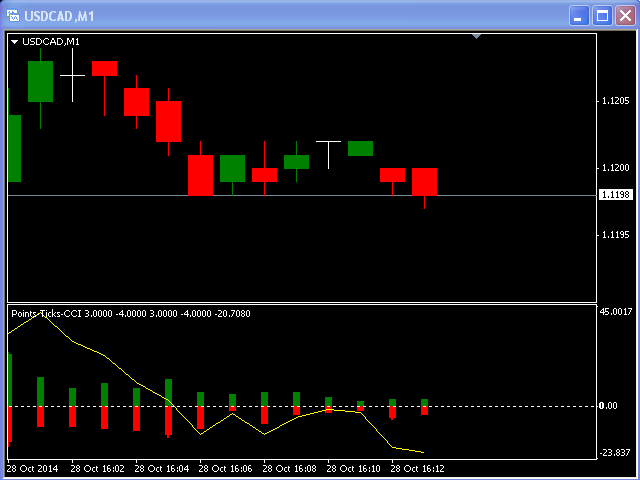
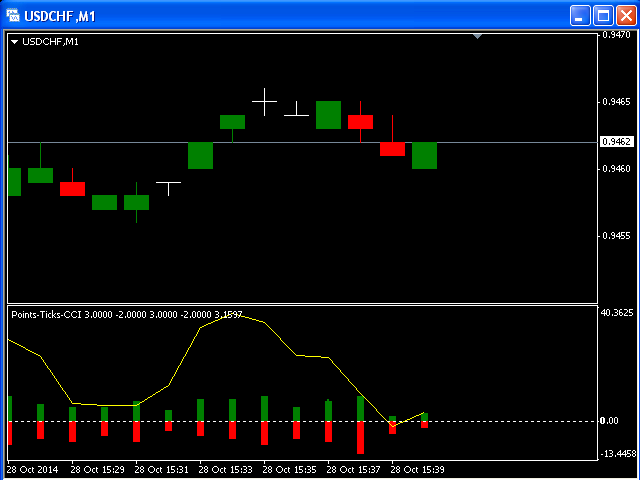
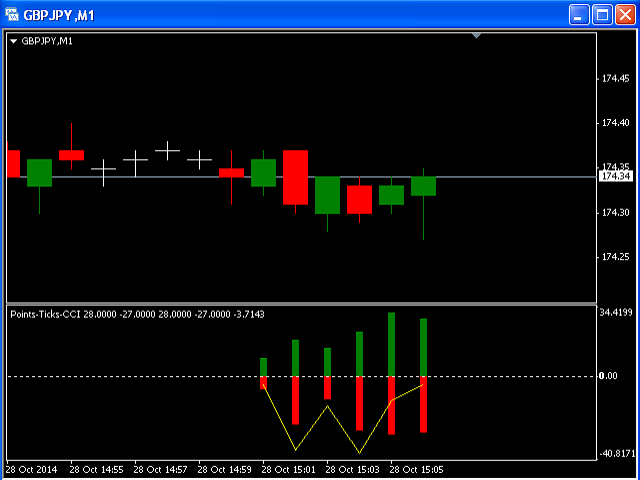
Dieser Indikator ist für den M1-Zeitrahmen konzipiert und zeigt an:
- Die Summe der Ticks, wenn der Preis steigt (Farbe Grün - Die Hauptkomponente einer Kerze = der Körper).
- Summe der Punkte, wenn der Preis steigt (Farbe Grün - Die Verlängerungslinien am oberen Ende der Kerze).
- Summe der Punkte, wenn der Kurs sinkt (Farbe Rot -Die Hauptkomponente einer Kerze = der Körper).
- Summe der Punkte, wenn der Preis nach unten geht (Farbe Rot - Die Verlängerungslinien am unteren Ende der Kerze).
- Zusätzlich wird der klassische Indikator Commodity Channel Index als Signallinie hinzugefügt (Farbe Gelb).
Der Indikator beginnt mit der Anzeige von Kerzen und CCI-Linien ab dem aktuellen Bar. Sie sollten ein paar Minuten warten, um diesen Indikator in Aktion zu sehen.