Points Ticks CCI MT4
- Indicateurs
- Version: 1.8
- Mise à jour: 24 avril 2020
- Activations: 5

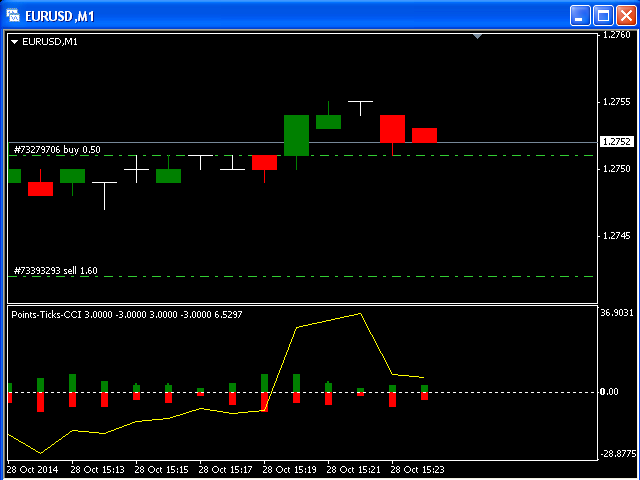
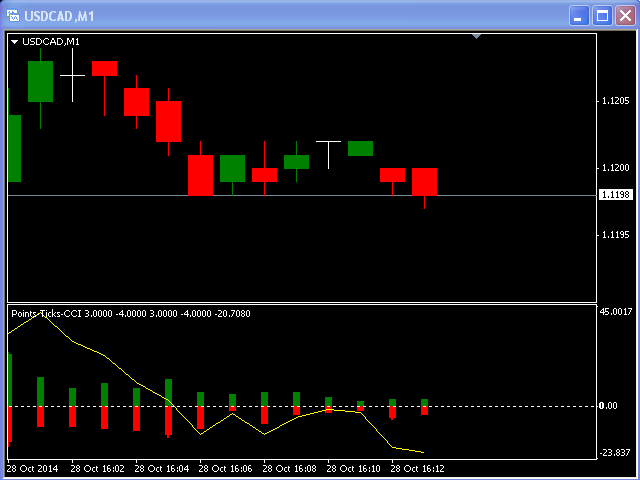
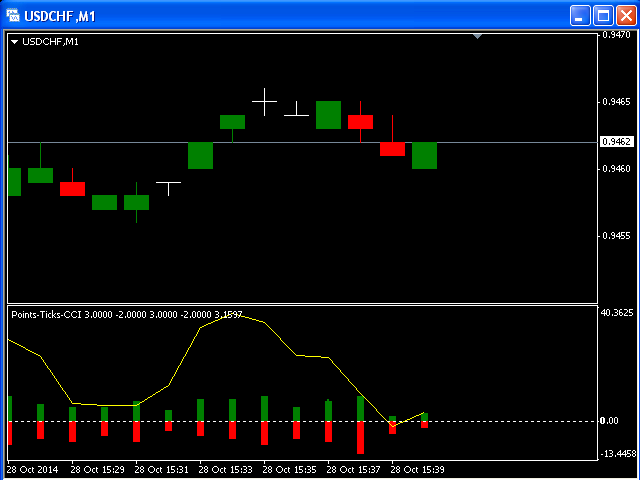
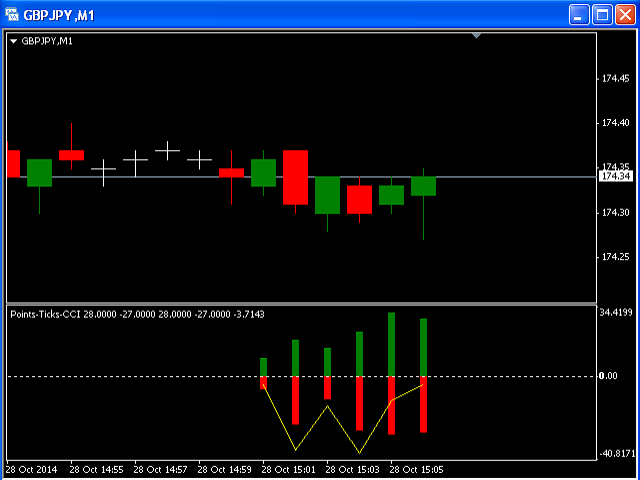
This indicator is designed for M1 time-frame and shows:
- Sum of ticks when the price goes up (color Green -The major component of a candlestick = the body).
- Sum of points when the price goes up (color Green -The extension lines at the top of the candle).
- Sum of points when the price goes down (color Red -The major component of a candlestick = the body).
- Sum of points when the price goes down (color Red -The extension lines at the lower end of the candle).
- Plus classical indicator Commodity Channel Index is added as a signal line (color Yellow).
The indicator will start to show candles and CCI lines from the current Bar. You should wait a couple minutes to see this indicator in action.