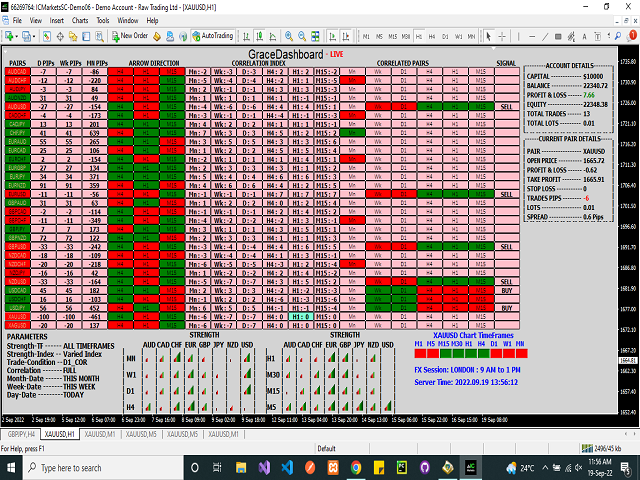
ArchIntel Dashboard
- Indicadores
- Versión: 1.20
- Actualizado: 6 febrero 2023
- Activaciones: 10

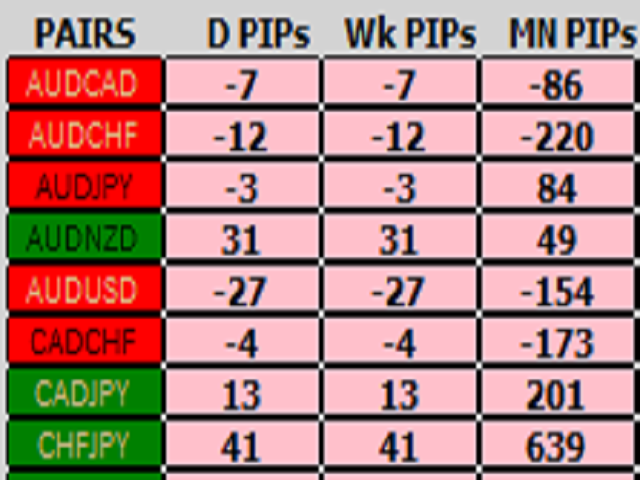
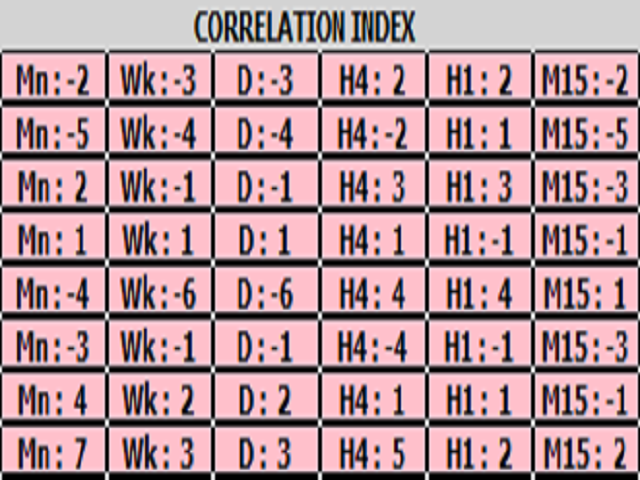
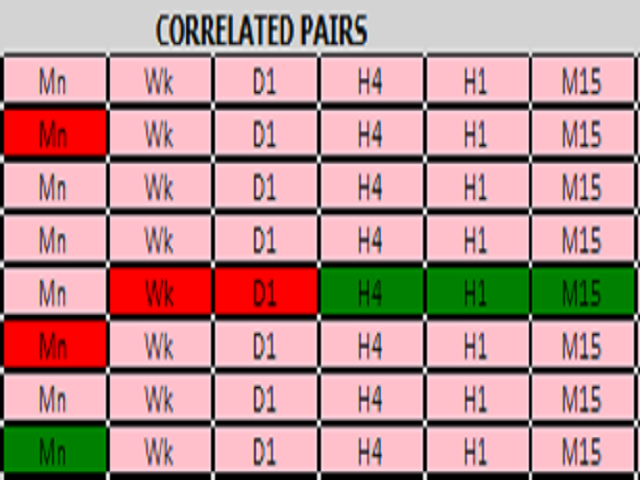
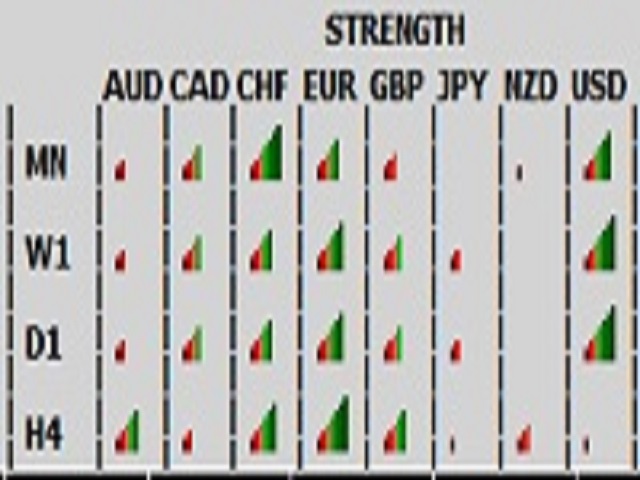
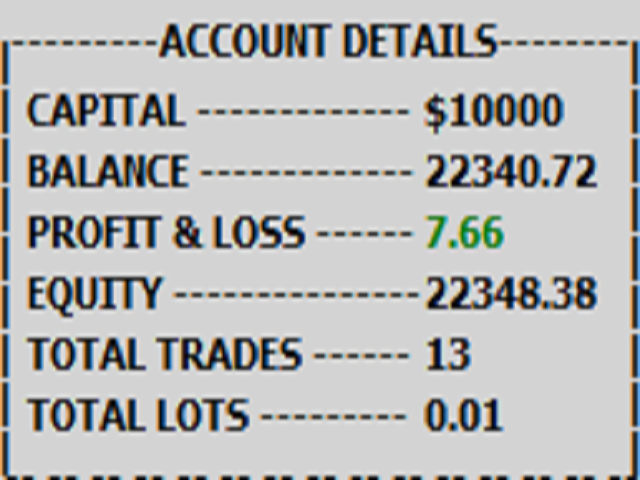
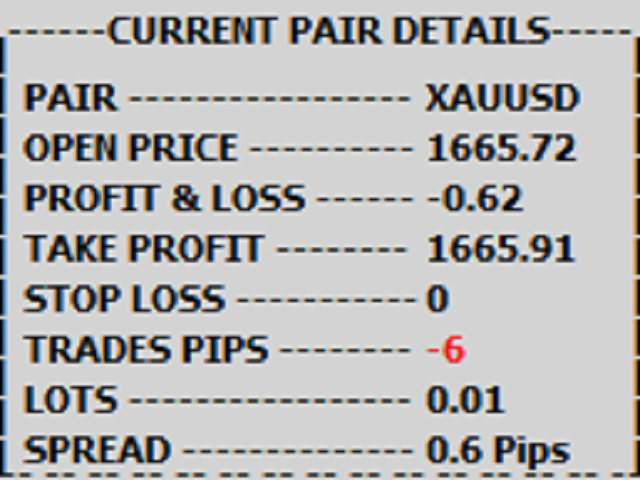
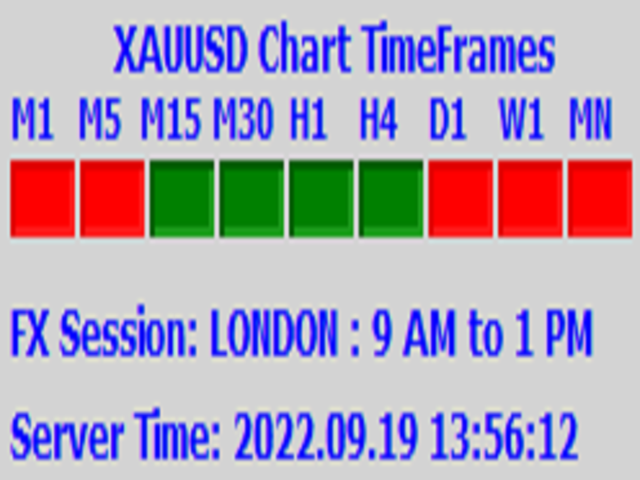
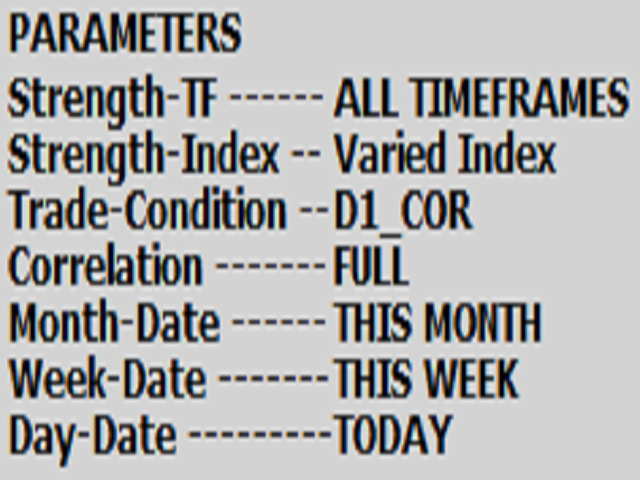
El medidor de fuerza ArchIntel es diferente del medidor de fuerza convencional. Muestra el índice de correlación para pares de divisas y divisas individuales, ver imagen 4 e imagen 6 para el índice de correlación de pares de divisas y el índice de fuerza de divisas. Este medidor de fuerza muestra el par correlacionado. EURJPY se utiliza para explicar la fórmula, EURUSD y USDJPY deben estar subiendo antes de que pueda comprar (Long ) EURJPY, viceversa es para vender. Cuando cualquiera de los pares de divisas se correlaciona utilizando esta fórmula, el rectángulo para el par específico será de color rojo o verde. Este medidor de fuerza muestra el último número de pips para el par de divisas, ver imagen 2. El indicador RSI se utiliza para confirmar la dirección del mercado y se muestra en la columna de dirección de la flecha, ver imagen 3. Las imágenes 7 y 8 se explican por sí mismas. Este medidor de fuerza muestra todos los marcos de tiempo para el par de divisas del gráfico actual, es decir, desde 1 minuto hasta 1 mes, si cualquiera de los marcos de tiempo para el par de divisas es alcista el color es verde, si el par de divisas es bajista el color es rojo, ver imagen 9. La imagen 11 es la visualización del parámetro elegido por el usuario en la configuración del indicador.
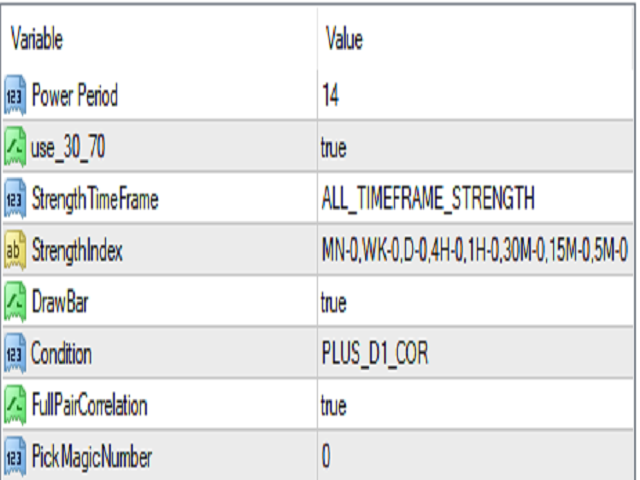
Parámetros
- int InpPeriod = 14;
- input bool use_30_70 = true;
- input MY_EnumTimeFrame FuerzaTiempoFrame = ALL_TIMEFRAME_STRENGTH;
- input string StrengthIndex = "MN-0,WK-0,D-0,4H-0,1H-0,30M-0,15M-0,5M-0";
- input bool DrawBar = true;
- input SELECT_CONDITION Condición = PLUS_D1_COR;
- sinput bool FullPairCorrelation = true;
- sinput int NúmeroMágico = 0;
Explicaciones de los parámetros
parámetro 2: " use_30_70 = true; " si se establece en true, el RSI utilizará la línea 30, 45, 55, y 70, si se establece en false, el RSI utilizará 45 y 55, si el RSI cruza cualquiera de estas líneas hacia arriba el cuadro de dirección Flecha se coloreará de verde y viceversa.
parámetro 3 es cuando el usuario desea mostrar el índice de fuerza para sólo un marco de tiempo específico o para todos los marcos de tiempo.
parámetro 4: Lo más importante a tener en cuenta aquí es el número después del signo "-". Por ejemplo, MN-0 significa vela mensual, el 0 significa vela actual, el usuario puede poner 1 para ver la última vela de los marcos temporales.
parámetro 5 se utiliza para determinar si la barra debe ser dibujado, si se establece en falso, los números se muestran.
parámetro 6 se utiliza para seleccionar las condiciones que se utilizarán para la columna de señales.
parámetro 7: FullPairCorrelation = true; ver arriba para la explicación de la fórmula de par correlacionado, este parámetro se utiliza para detectar cuando el par de divisas no está correlacionado.
parámetro 8: 0 es el número mágico de la operación abierta manualmente, el número mayor que 0 es más probable que sea una operación robot. si se establece en cero el indicador se utiliza para mostrar las propiedades de la operación abierta manualmente, el usuario puede poner el número mágico de la operación abierta por el robot en él también.
Usted puede experimentar con los ajustes para tener una mayor comprensión de este indicador de fuerza.

El usuario no ha dejado ningún comentario para su valoración