Pluuto Alert
- Indicadores
- Versión: 1.0
- Activaciones: 5

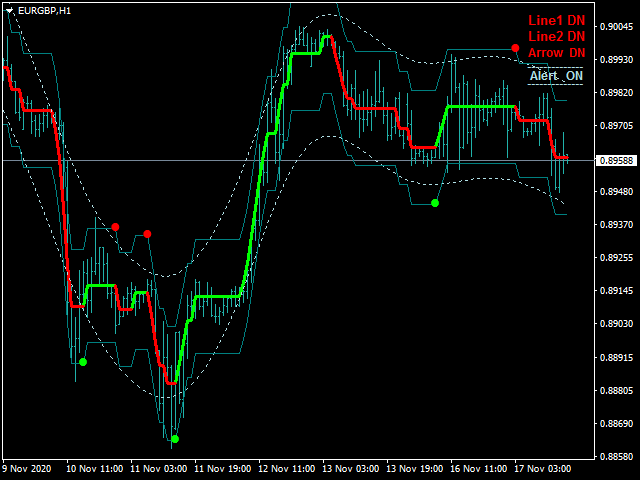
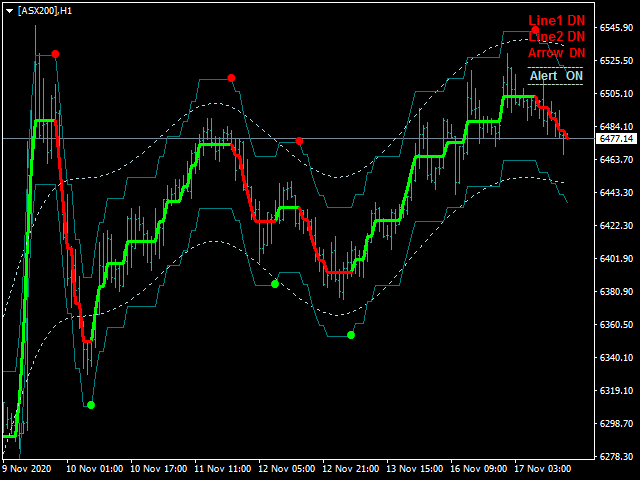
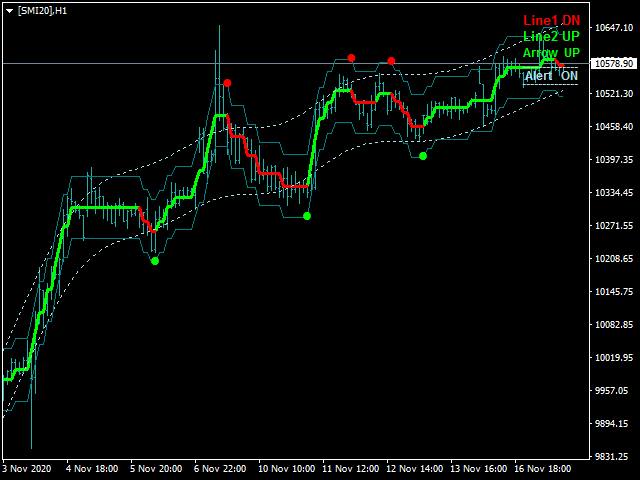
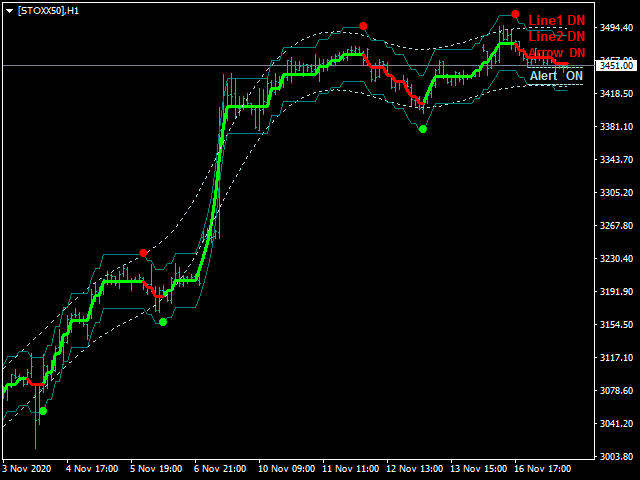
Este indicador Pluuto Alerta indicator.Indicator muestra el movimiento de tendencia.Indicator calcula automáticamente line.Alert = arrow.When la alerta es hacia arriba la siguiente alerta es hacia abajo,cuando la alerta es hacia abajo la siguiente alerta es hacia arriba (nueva barra).
Características
- FiltPer -muestra indicador period.Line1.
- FiltPer2 - muestra el indicador period.Line2.
- Multiplicador - muestra el multiplicador del indicador.(FlitPer,Line1;step)
- Desviación1 - muestra la desviación del indicador.(Line2)
- Desviación2 - muestra la desviación del indicador.(Flecha)
- Tendencia - muestra la tendencia del indicador (verdadero/falso).
- Alerta de tendencia - muestra la alerta de tendencia del indicador (verdadero/falso).
- X - mueve la tendencia a izquierda y derecha.
-
- Y - mueve la tendencia arriba y abajo.
-
- Si el color de la Tendencia es verde, la tendencia es alcista.
-
- Si el color de la tendencia es rojo, la tendencia es bajista.
-
Cómo entender el estado:
Indicador mejor timeframe (M1-M30 FiltPer 30),(H1-MN FiltPer 15)
//////////////////////////////////////////////////////////////////////////////////////////////////////////////////////////////////////////////////////
//////////////////////////////////////////////////////////////////////////////////////////////////////////////////////////////////////////////////////
/////////////////////////////////////////////////////////////////////////////////////////////////////////////////////////////////////////////////////
/////////////////////////////////////////////////////////////////////////////////////////////////////////////////////////////////////////////////////
//////////////////////////////

он рисует