Super Power
- Indicadores
- Versión: 1.0
- Activaciones: 5

Este indicador muestra un movimiento de tendenciasuperpotente .
Características
- Multiplicador - muestra el movimiento del multiplicador.
- Multiplicador2 - muestra el movimiento del multiplicador2.
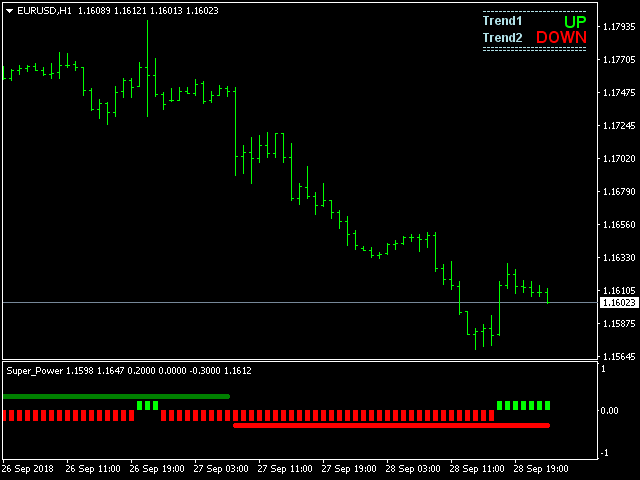
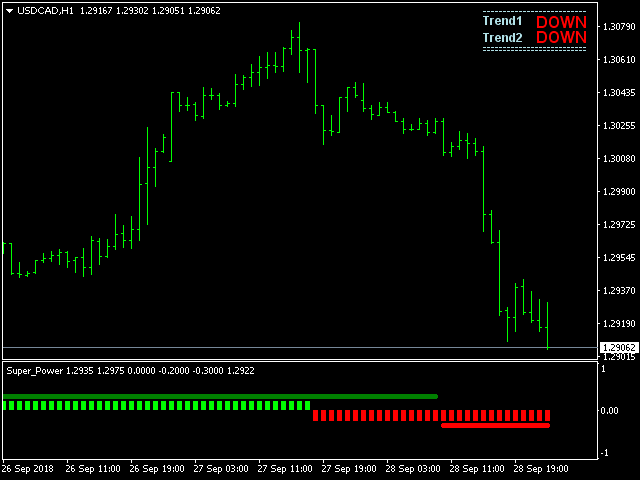
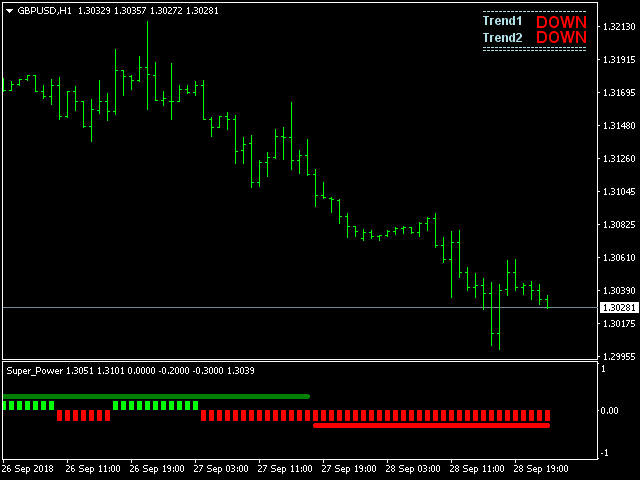
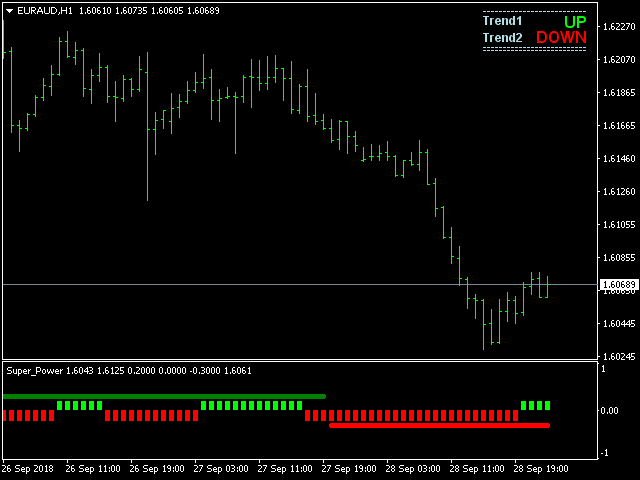
- Tendencia muestra la tendencia del indicador 1 y la tendencia 2 (verdadero/falso).
- ventana_separada - muestra la ventana de tendencia separada.(0-1....)
- X - mueve la tendencia a izquierda y derecha.
- Y - mueve la tendencia arriba y abajo.
Cómo entender el estado:
- Si el color de la tendencia es verde, la tendencia es alcista.
- Si el color de la tendencia es rojo, la tendencia es a la baja.