Super Power Beeta
- Indicadores
- Versión: 2.0
- Activaciones: 5

Este indicador muestra Super Power Beeta tendencia movement.Indicator es la versión 2 .
Características
- Multiplicador - muestra el movimiento multiplicador.
- Multiplicador2 - muestra el movimiento del multiplicador2.
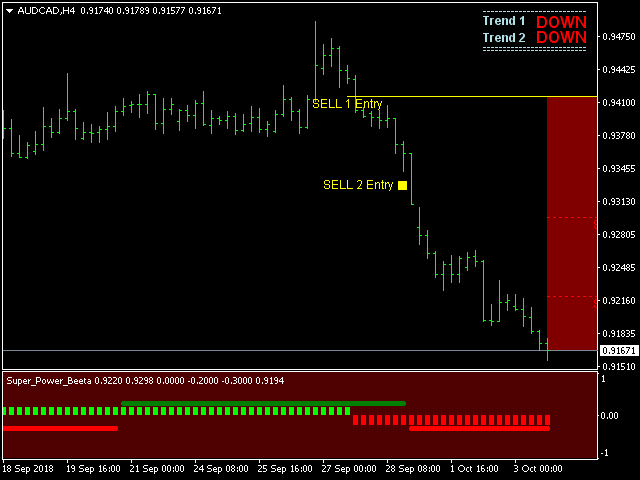
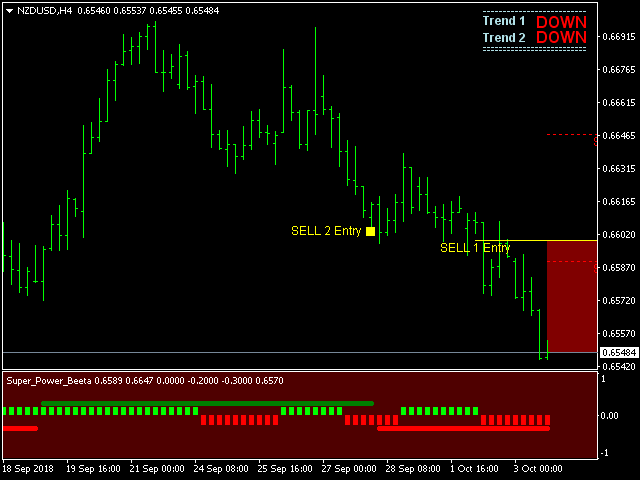
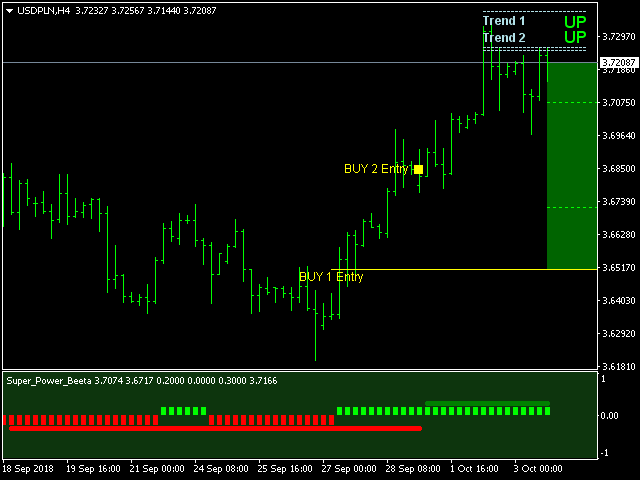
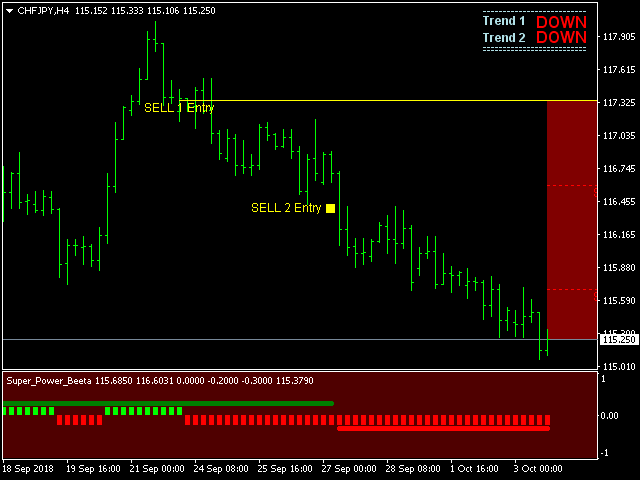
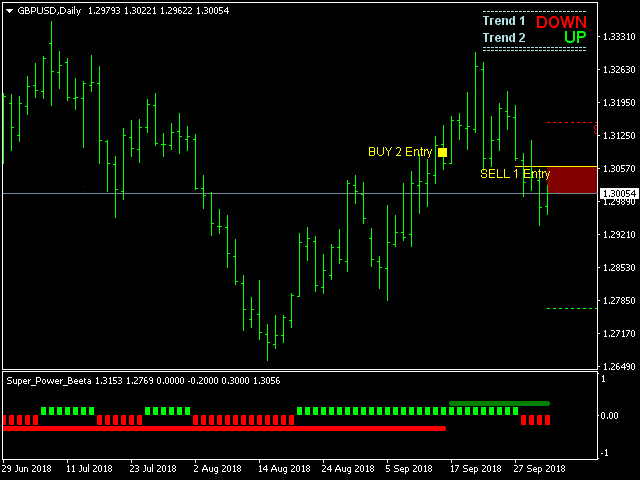
- Tendencia muestra la tendencia del indicador 1 y la tendencia 2 (verdadero/falso).
- Fondo:color - muestra el color de fondo (verdadero/falso).
- ventana_separada - muestra la tendencia de la ventana separada.(0-1....)
- ventana_separada2 - muestra la tendencia (color de fondo) en una ventana separada.(1-2....)
- X - mueve la tendencia a izquierda y derecha.
- Y - mueve la tendencia arriba y abajo.
Como entender el estado:
- Buy 1 Entry - la tendencia es alcista (corto)
- Buy 2 Entry - la tendencia es alcista (larga)
- Sell 1 Entry - la tendencia es bajista (corto)
- Sell 2 Entry - tendencia bajista (larga)
- Sell Stop 1 - Vender 1 Entrada (stop)
- Sell Stop 2 - Entrada Sell 2 (stop)
- Buy Stop1 - Entrada Bay 1 (stop)
- Buy Stop 2 -Bay 2 Entry (stop)
- Si el color de la tendencia es verde, la tendencia es alcista.
- Si el color de la tendencia es rojo, la tendencia es bajista.