X Trend Pluss
- Indicadores
- Versión: 1.0
- Activaciones: 5

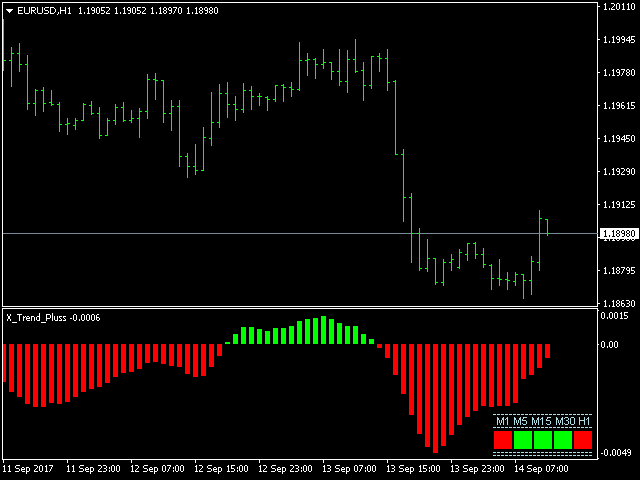
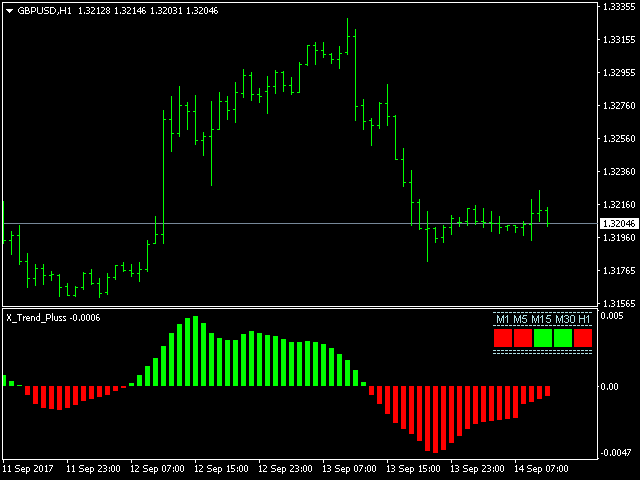
Este indicador muestra los movimientos de la tendencia.
Parámetros
- Tendencia: Muestra los movimientos de la tendencia, verdadero/falso.
- X: mueve la tendencia a izquierda y derecha.
- Y: mueve la tendencia arriba y abajo.
Cómo entender el estado:
- (M1), el cuadrado indica el marco temporal de 1 minuto. Si el cuadrado es verde, la tendencia es alcista. Si el cuadrado es rojo, la tendencia es bajista.
- (M5), el cuadrado indica el marco temporal de 5 minutos. Si el cuadrado es verde, la tendencia es alcista. Si el cuadrado es rojo, la tendencia es bajista.
- (M15), el cuadrado indica el marco temporal de 15 minutos. Si el cuadrado es verde, la tendencia es alcista. Si el cuadrado es rojo, la tendencia es bajista.
- (M30), el cuadrado indica el plazo de 30 minutos. Si el cuadrado es verde, la tendencia es alcista. Si el cuadrado es rojo, la tendencia es bajista.
- (H1), el cuadrado indica el plazo de 1 hora. Si el cuadrado es verde, la tendencia es alcista. Si el cuadrado es rojo, la tendencia es bajista.
Si la barra indicadora es verde, la tendencia es alcista. Si la barra indicadora es roja, la tendencia es bajista.