Support and Resistance 5 days MT5
- Indicadores
- Versión: 1.6
- Actualizado: 19 noviembre 2021
- Activaciones: 5

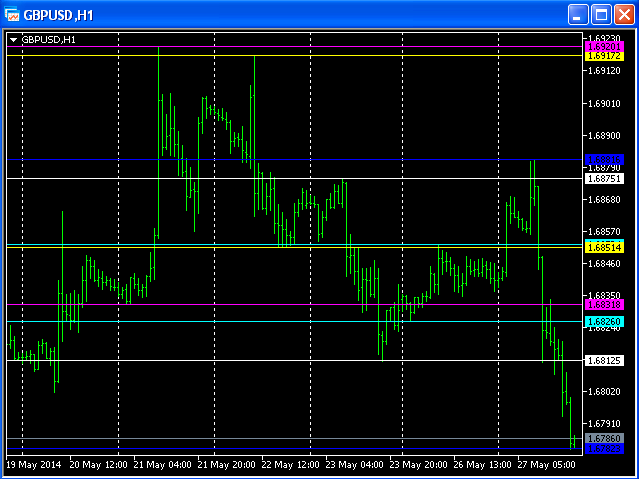
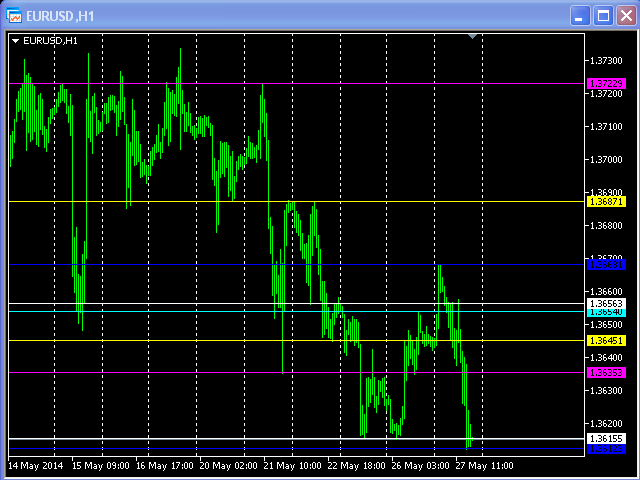
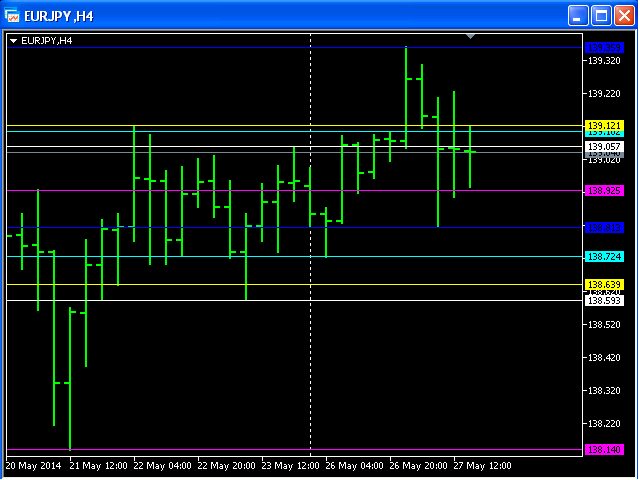
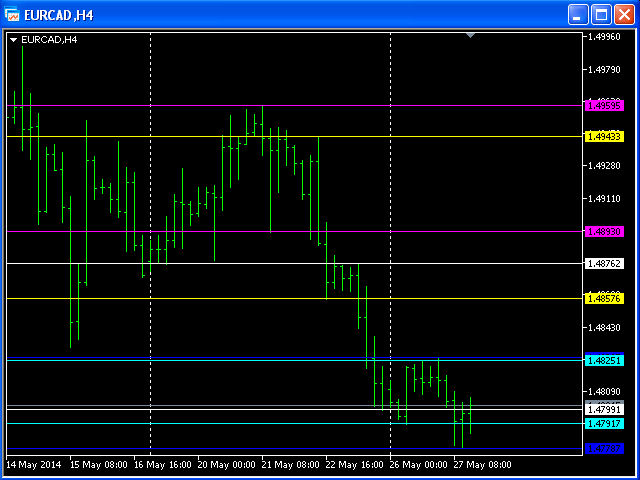
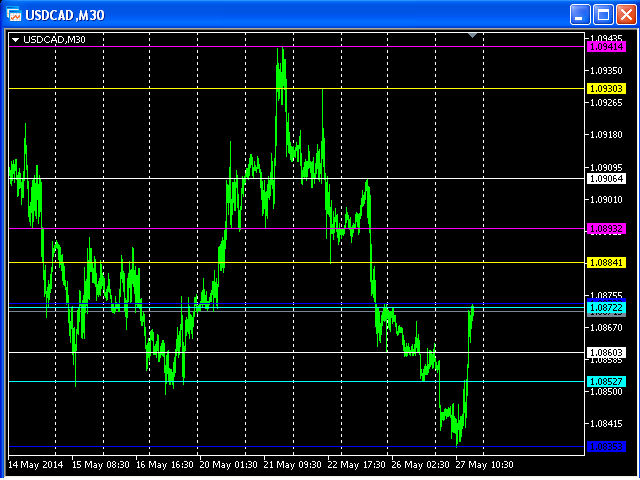
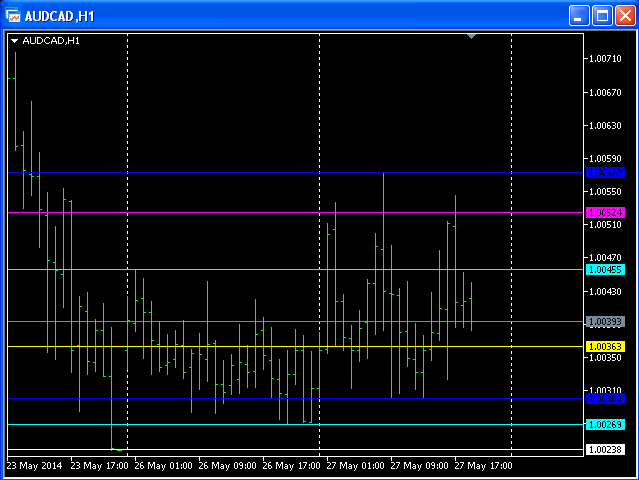
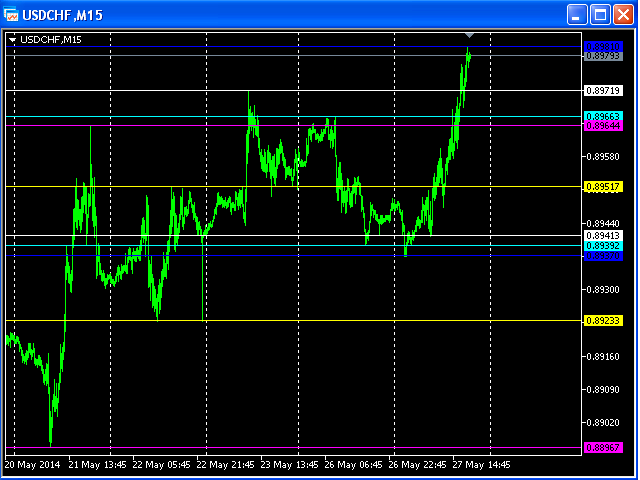
El soporte y la resistencia representan coyunturas clave en las que confluyen las fuerzas de la oferta y la demanda.
Una nota interesante es que los niveles de resistencia a menudo pueden convertirse en zonas de soporte una vez que se han superado.
Este indicador calcula y dibuja 5 pares de líneas de "Soporte y Resistencia" como "Máximo y Mínimo" del día actual y de los 4 días anteriores.