Fibo World MT5
- Indicadores
-
Pavel Verveyko
 Writing scripts, indicators, EAs on MQL5 and MQL4.
Fast, Reliable, And High-Quality.
For all questions, please contact personal messages. - Versión: 1.1
- Activaciones: 5
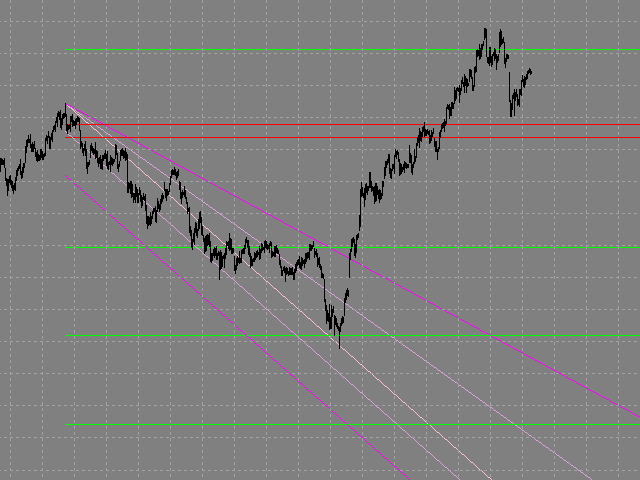
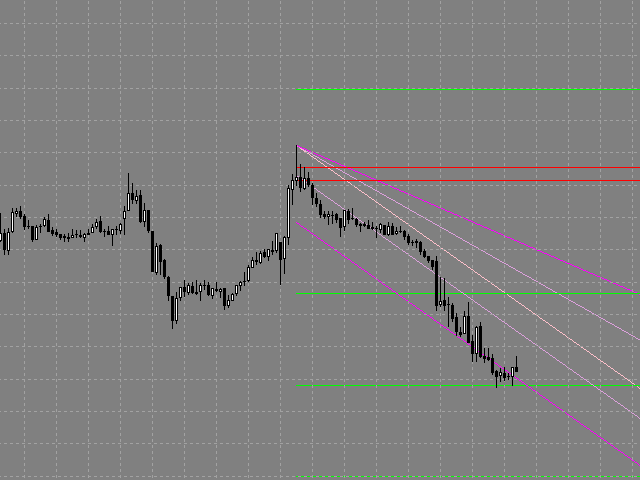
El indicador construye un análisis gráfico basado en la teoría de Fibonacci.
Fibo Fan se utiliza para el análisis de los impulsos y correcciones del movimiento.
Las líneas de reversión (2 líneas en la base del abanico de Fibonacci) se utilizan para analizar la dirección de los movimientos.
El indicador muestra la de 4 la línea objetivo en cada dirección.
El indicador tiene en cuenta la volatilidad del mercado.
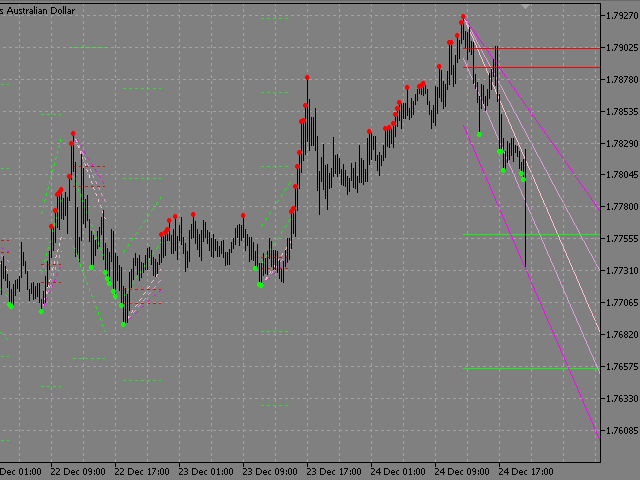
Si el precio está por encima de las líneas de inversión, tiene sentido considerar la compra, si está por debajo, entonces la venta.
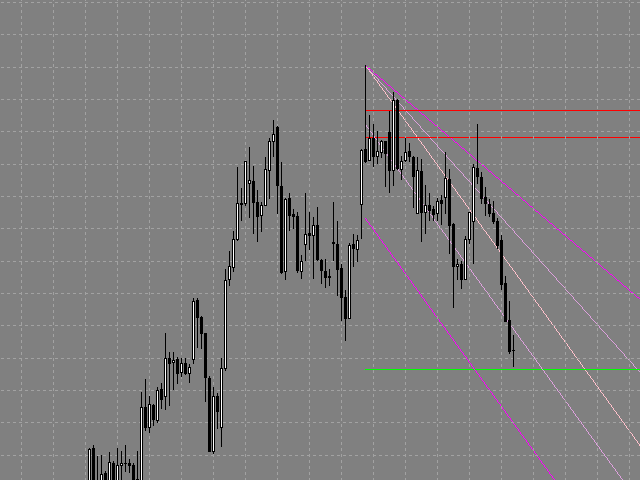
Puede abrir posiciones después de una ruptura, rebote o prueba en el lado inverso de cualquier línea de inversión, objetivo o abanico.
Cuando la situación del mercado cambia, el indicador Fibo cambia de dirección.
Ajustes:
- Show_History_Size - tamaño del historial mostrado.
- Fibo_Period - número de velas a construir.
- Fibo_Size_min - tamaño mínimo del abanico de Fibo (en velas).
- Show_Last_Fibo - ocultar/mostrar los Fibos pasados.
- Show_Extremum - ocultar/mostrar el extremo.
- Send_Sound - alerta sonora.
- Send_Mail - envía una notificación por correo electrónico.
- Send_Notification - envía una notificación móvil.
- Send_Alert - alerta de terminal estándar.
- Estos son los ajustes más importantes. También puede cambiar las siguientes características: color, grosor, estilo.