Force Fx Option
- Indicadores
-
Nacer Kessir
 I am an engineer in applied mathematics, Forex is my preferred activity for more then nine years.
 - Versión: 1.0
- Activaciones: 5
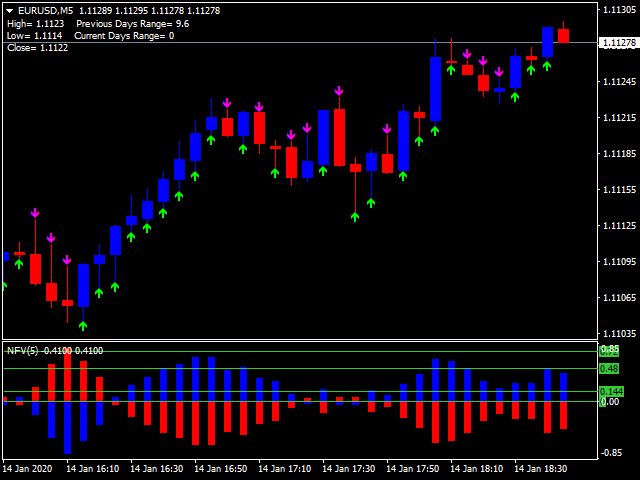
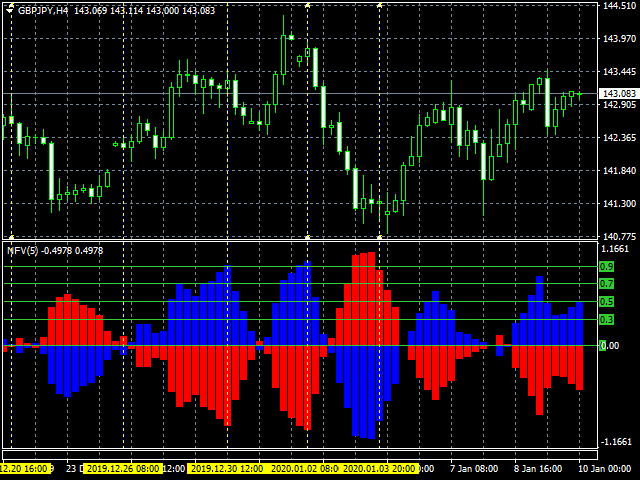
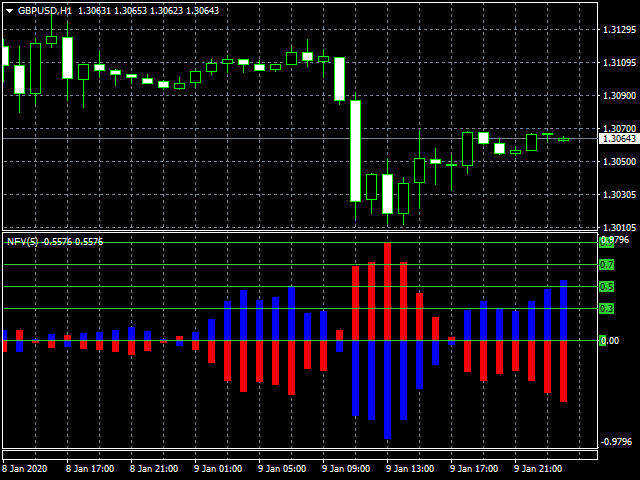
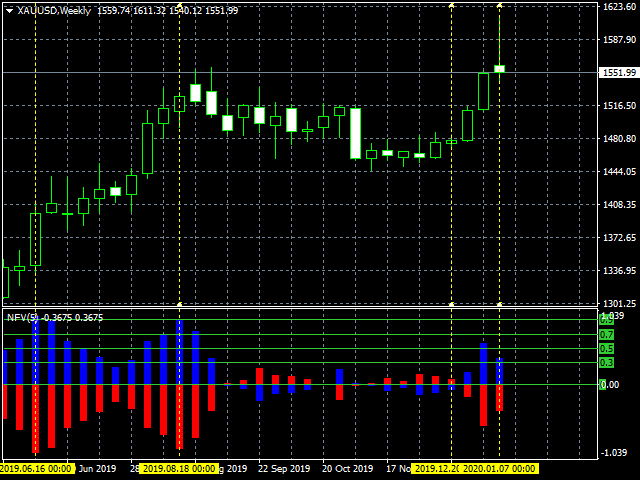
Este indicador que muestra la dirección precisa de los precios, y la fuerza de esta dirección, inversiones, añadido a cualquier gráfico y suprimir cualquier confusión.
Calcula la fuerza de la dirección actual y predice las reversiones de precios con un alto grado de precisión con sus niveles clave y es ideal para scalping, o swing trading.
Para cualquier marco de tiempo el siguiente comportamiento es el mismo:
- El histograma azul por encima de 0.0 significa que los compradores dominan el movimiento del precio.
- Por otro lado, un histograma rojo por encima de 0.0 significa que los vendedores dominan el movimiento de los precios.
- Si el histograma (rojo o azul) pasa por encima de 0,92 o más y vuelve por debajo de este valor es una señal muy alta de reversión de la dirección o al menos un movimiento correctivo. .
*No Repinta
¡*Indicador perfecto para opciones binarias !
*Solo para MT4
*Grandioso Para Scalping
*Grandioso para Swing Trading
*Works On Any Timeframe
*Trabaja en cualquier par de Mt4
*Perfecto para traders principiantes y expertos.
Para scalpin y trading diario , recomiendo usar parametros predefinidos , para swing puede modificar Npi por ejemplo a 8 o 13 .