Engulfing 4 Umbrella
- Indicadores
- Versión: 1.0
- Activaciones: 5

Para este conjunto de indicadores
1. Información general
- Calcula con algoritmos matemáticos de alto rendimiento.
- Calculado a partir del precio de las velas
- El punto de entrada de esta orden se filtra por el tren EMA y el oscilador.
- Calcula la integridad de la vela.
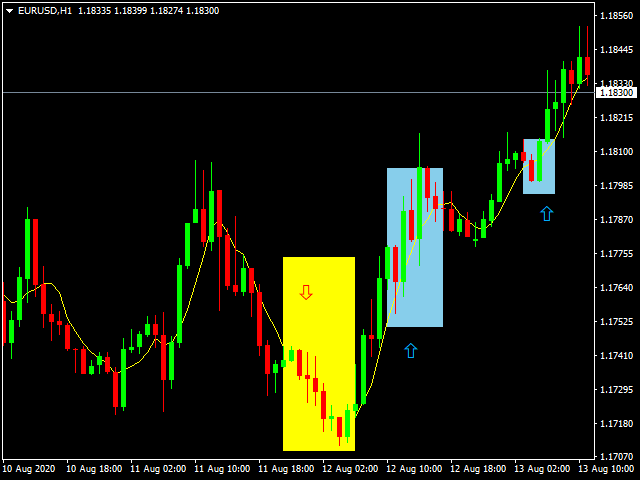
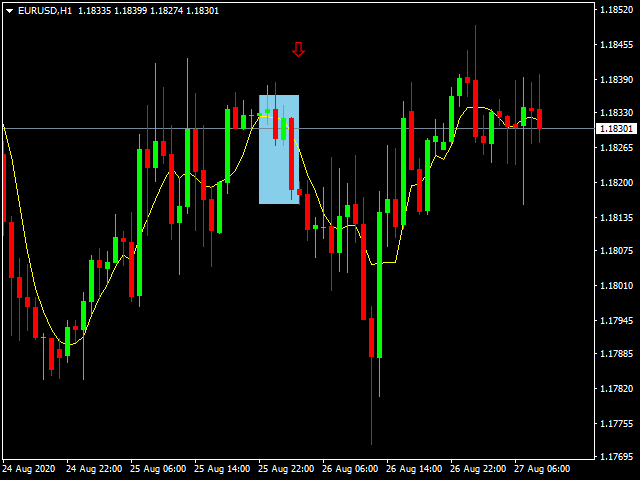
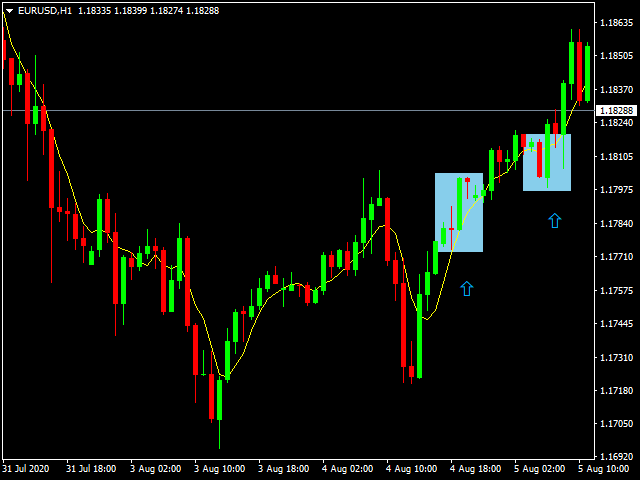
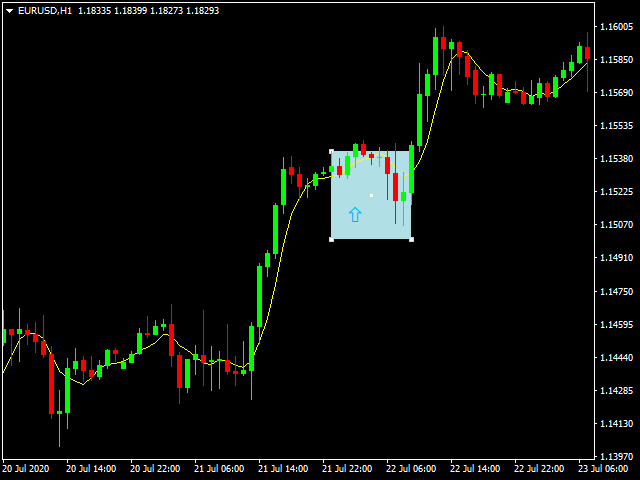
2. ¿Cómo funciona?
- Puede ver dos tipos de puntos de entrada de la orden: la notificación en el monitor y la flecha.
- Usted puede confiar en un 75-95 por ciento de este punto de entrada.
3. Configuración
- Una vela completa está entre 61.8-100%.
- EMA Low es la tendencia principal, 100 - 250.
- EMA Fast es una sub-tendencia de 13 - 55.
- SMA es un filtro, a corto plazo es de 5 - 10.
- RSI es comprar demasiado (70-90) (Sobrecompra)
- RSI es vender demasiado (10-30) (Sobreventa)
- RSI es la tendencia (14)
4. Utilice
- Vea la flecha resultante, puede introducir la orden inmediatamente.
- Notificaciones 1. Monitor 2. Por correo electrónico 3. 4. Por teléfono móvil
5. ¿Para quién es adecuado?
- Forex Time frame H1 1 o superior
- Opciones Binarias (M1-M15)
- Operación corta, operación media, operación larga