Rush Point Histograma
- Indicadores
- Versión: 1.0
- Activaciones: 5

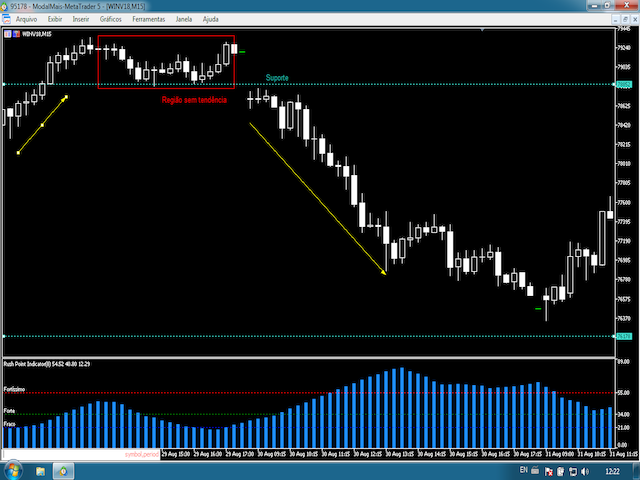
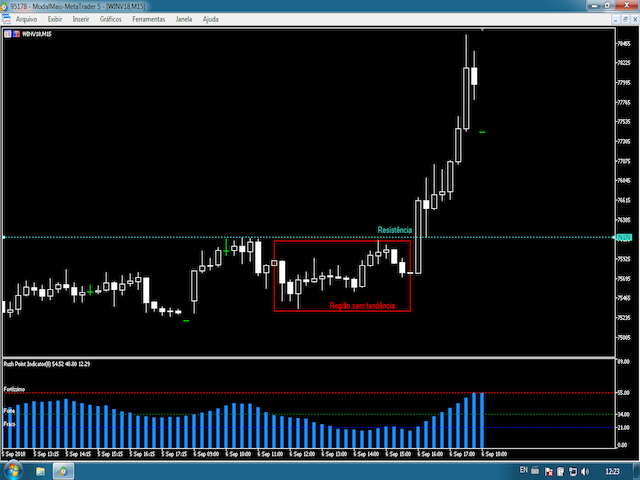
Rush Point Histogram Indicador de fuerza de continuidad.Funcionamiento: Después de una ruptura de soporte o resistencia de un activo, el trader puede entender mediante la lectura del histograma si tal movimiento tiende a continuar, filtrando así falsas rupturas o rupturas cortas sin formación de tendencia. A través de una lectura simple, basada en niveles, el trader puede tomar una decisión basada en el histograma, donde: Por debajo de 21: No hay formación de tendencia 21 a 34: Tendencia débil De 34 a 55: Tendencia fuerte De 55 a 89: Tendencia fuerteLectura sugerida: Observación de ruptura de soporte o resistencia, comprobar: El histograma es superior a 21 El histograma es alcista en las 2 últimas barras En estas condiciones, estadísticamente, es posible que la tendencia esté fijada. Nota: Por debajo del nivel 21, aunque sea alcista, el indicador detecta consolidación.