Utilities
- Indicadores
-
Douglas Lucio De Araujo
 Simple, turn your Trading System into an indicator.
 - Versión: 1.0
- Activaciones: 5
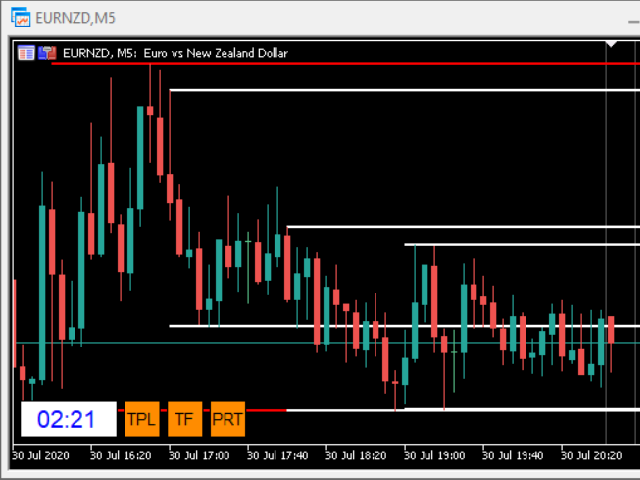
Indicador con 3 funciones
- Reloj: Reloj independiente del gráfico, el conteo continúa incluso cuando el mercado está cerrado.
- Plantilla: Tras establecer una configuración en cualquier gráfico, ya sean patrones de color, indicadores, zoom... La configuración se copiará a todos los gráficos activos.
- TimeFrame: Establezca el TimeFrame en un gráfico, y con un solo clic todos los gráficos activos cambiarán al mismo TimeFrame.