Pivots Channels Breakouts
- Indicadores
- Versión: 1.0
- Activaciones: 10

Pivots Channels Breakouts presenta 16 fórmulas diferentes para Niveles Pivots. Dibuja cada una de ellas y también dibuja canales específicos, histogramas de tendencias y niveles SL/TP derivados de ellas.
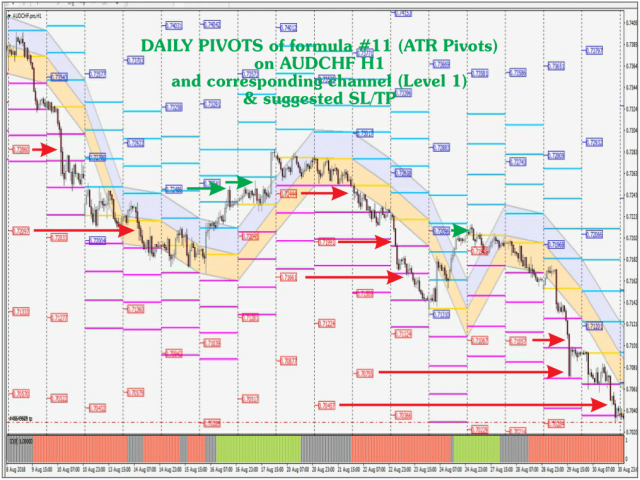
Incluye fórmulas de uso común como Pivotes Clásicos, Woodie, ATR, Fibonacci, Camarilla y Demark, y también presenta fórmulas nunca vistas basadas en la secuencia matemática de Padovan.
El precio suele reaccionar en los niveles de los Pivotes, y en las Resistencias (R) y Soportes (S) de estas fórmulas. Por eso, muchos operadores las observan y las tienen en cuenta en sus operaciones.
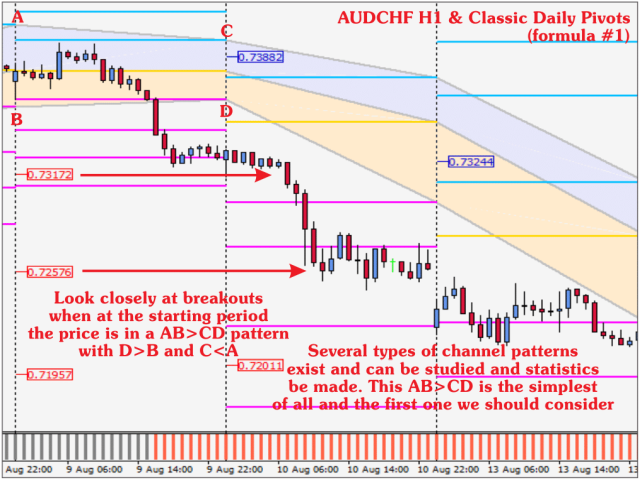
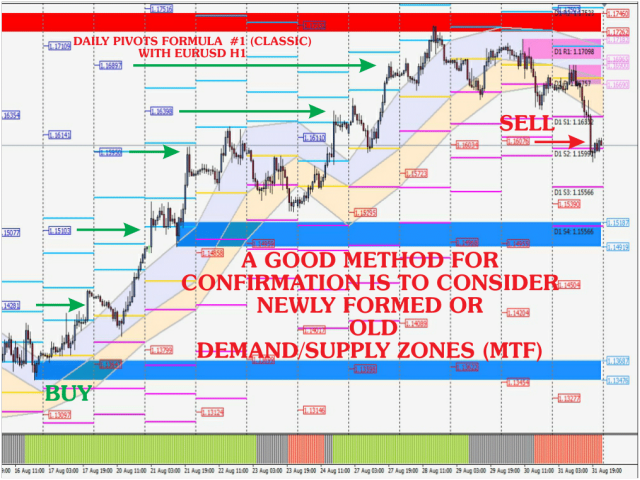
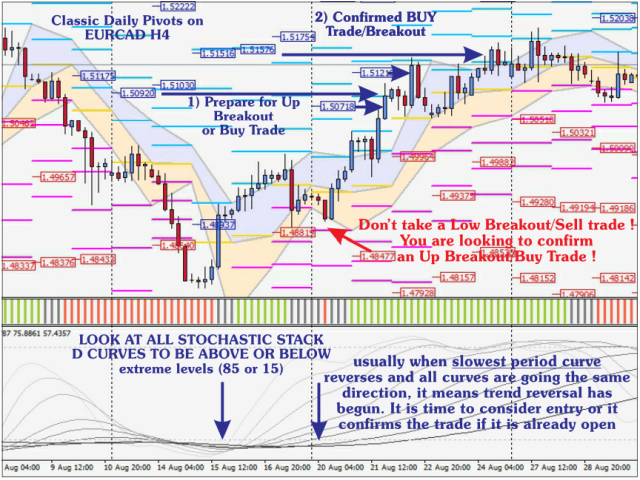
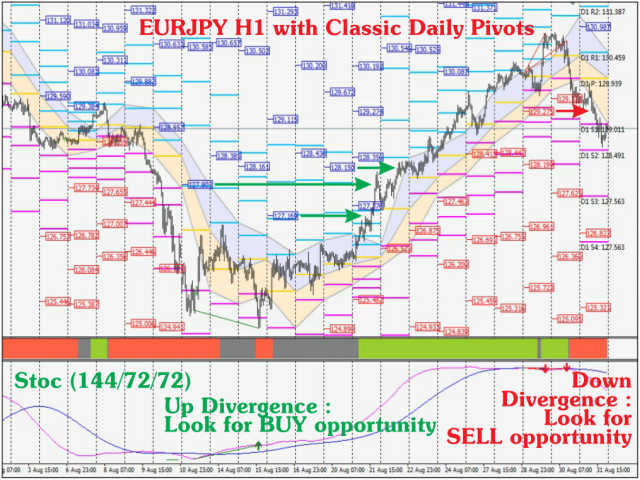
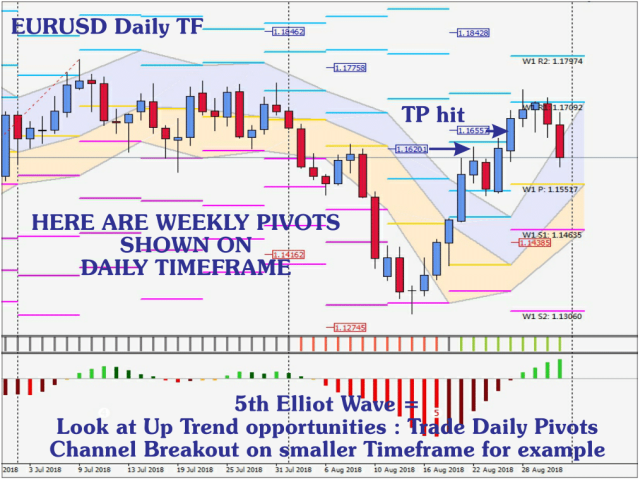
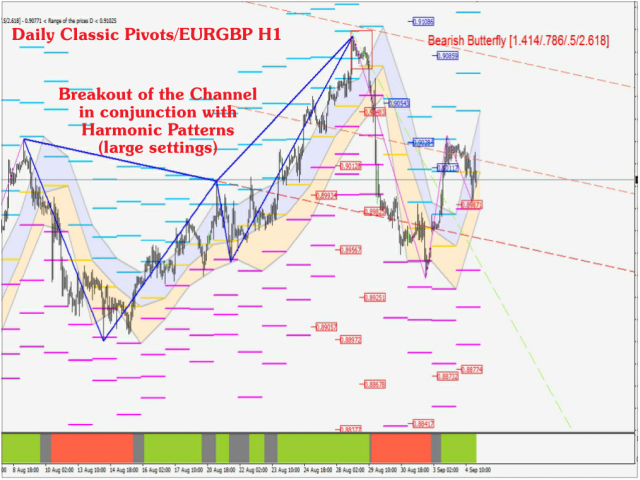
El indicador traza canales derivados de los niveles de Resistencia y Soporte y permite considerar la ruptura de estos canales para una posible operación en la dirección de la ruptura. Operar utilizando la información proporcionada por el indicador para las operaciones de ruptura puede no ser el único enfoque exitoso, pero el indicador fue pensado para ser utilizado de esta manera. El propósito no es entrar en cada ruptura, pero si las entradas se filtran adecuadamente teniendo en cuenta la fuerza de la moneda, los niveles de sobrecompra / sobreventa (utilizando estocástico con períodos coherentes, por ejemplo, o estocástico D curvas Stack) o zonas de oferta / demanda, habrá notablemente más operaciones ganadoras que perdedoras, lo que hace que el indicador muy valioso.
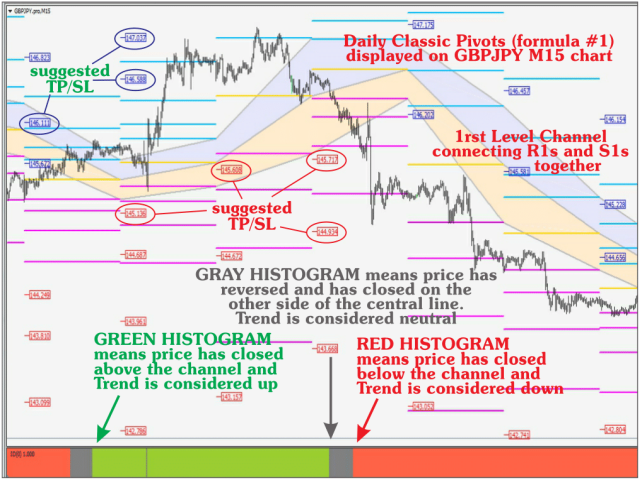
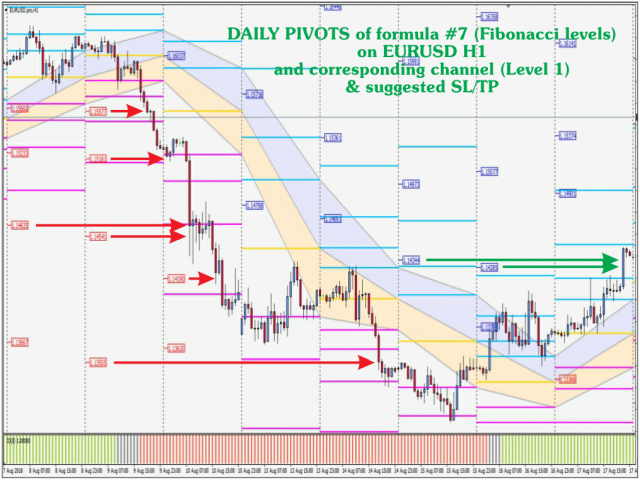
El indicador sugiere puntos de entrada observando las rupturas inminentes, actuales o recientemente pasadas de los canales, pero la gestión de las operaciones también es crucial: un operador tiene que colocar con precisión el Stop Loss (SL) y el Take Profit (TP). Las propias resistencias, soportes y pivotes pueden utilizarse como SL/TP, pero además, el indicador propone niveles de precios muy significativos que pueden utilizarse para decidir el SL y el TP. Estos niveles de precios altamente significativos se derivan de los valores de Pivotes, Resistencias y Soportes.
Las capturas de pantalla presentan algunos métodos para filtrar las operaciones, pero no son exhaustivos y el operador podrá utilizar uno o varios a su discreción.
Se aconseja primero estudiar y acostumbrarse a la fórmula Clásica y su canal, antes de estudiar y utilizar eventualmente otras fórmulas. Algunas de las fórmulas tienen 9 Niveles de Resistencia y 9 Niveles de Soporte pero como cada uno de estos niveles se puede activar o desactivar independientemente, es posible dibujar sólo los niveles que nos parezcan necesarios o significativos. Para las fórmulas Padovan, por ejemplo, encontraremos que habilitar sólo los niveles impares (niveles 1 - 3 - 5 - 7 - 9) o sólo los pares (niveles 2 - 4 - 6 - 8) es deseable o suficiente. Esto se debe a la naturaleza de la secuencia padovana (1 - 1 - 1 - 2 - 2 - 3 - 4 - 5 - 7 - 9 - 12 - 16 - 21 etc) en la que un número es la suma del antepenúltimo número y su predecesor. Esta secuencia hace que las estructuras derivadas de ella sean aún más cercanas a la naturaleza que las estructuras derivadas del número áureo y de la secuencia de Fibonacci.
Parámetros
- ID único de instancia
- Auto Match TF
- Timeframe - timeframe con el que se relaciona el cálculo de Pivots, Soportes y Resistencias
- Seleccionar Tipo de Pivote - 16 fórmulas diferentes
- Periodo A TR - para la fórmula ATR o F11
- Mostrar Pivote Central
- Mostrar Nivel Todo - si se establece en falso, permite trazar niveles específicos de Resistencias y Soportes
- Mostrar Nivel (1 a 9) - 1 significa Resistencia 1 y Soporte 1 juntos, 2 significa Resistencia 2 y Soporte 2 juntos, etc.
- Seleccionar Nivel de Canal - L1 es para canales que conectan sucesivamente Resistencias 1 y Soportes 1, L2 para canales que conectan sucesivamente Resistencias 2 y Soportes 2, etc
- Anchura, estilo y color de la línea R
- Anchura, estilo y color de la línea Pivot
- Ancho, estilo y color de la línea S
- Dibujar canal o no
- Periodos de recuento de canales - periodos para los que se dibujan los canales en el gráfico
- Ancho, estilo y color del borde del canal
- Anchura, estilo y color del canal central
- Canal Superior Color
- Color inferior del canal
- Dibujar Etiqueta Precio Pivote
- Color de la etiqueta de precio pivote
- Períodos de recuento de etiquetas de precio de pivote: períodos para los que se dibujan las etiquetas de precio de pivote, resistencia y soporte en los gráficos.
- Dibujar etiqueta de precio SL/TP sugerido
- Etiqueta de precio Color Up
- Etiqueta de precio Color Bajada
- Períodos de recuentode etiquetas de precio sugeridas: períodos para los que las etiquetas de precio sugeridas se dibujan en el gráfico.
- Draw mids 1st/2nd and 2nd levels - aplicable sólo para la fórmula Classic o F1
- Colordel rectángulo superior - Color del rectángulo superior de la fórmula clásica
- Color del rectánguloinferior - color del rectángulo inferior de la fórmula clásica
- Contar periodos - periodos para los que se dibujan los rectángulos (fórmula clásica)