Multi Time Frame RSI Indicator
- Indicadores
- Versión: 1.0
- Activaciones: 5

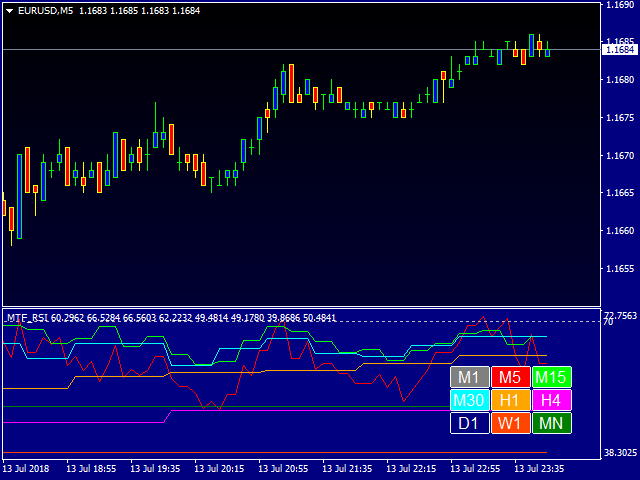
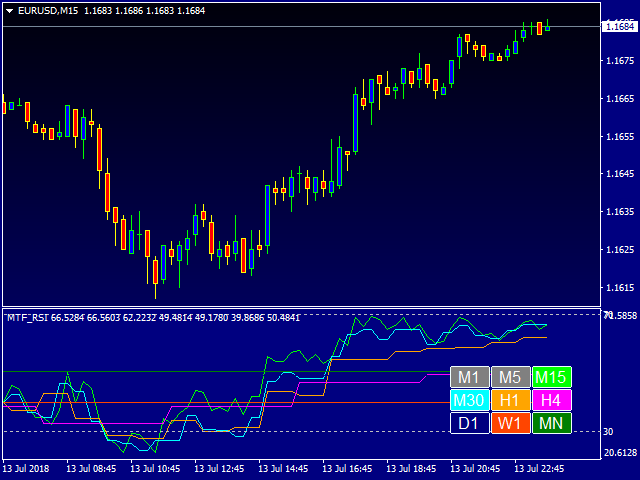
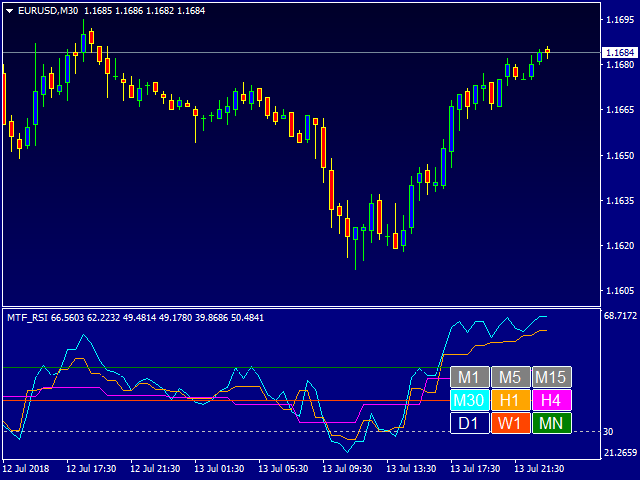
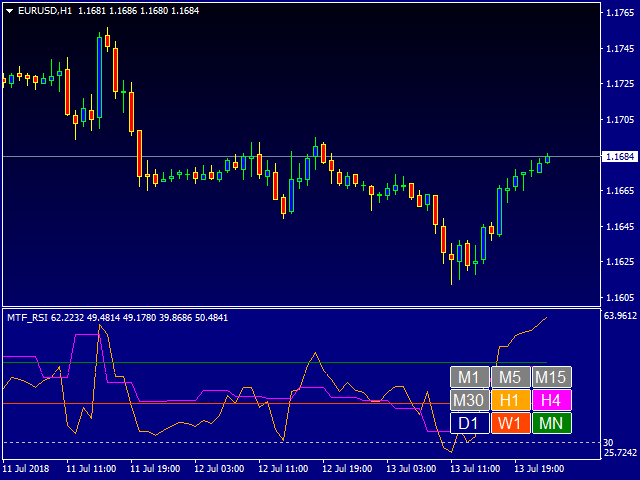
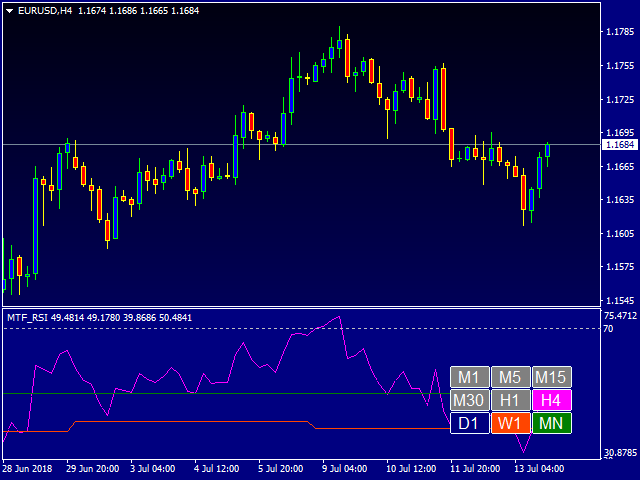
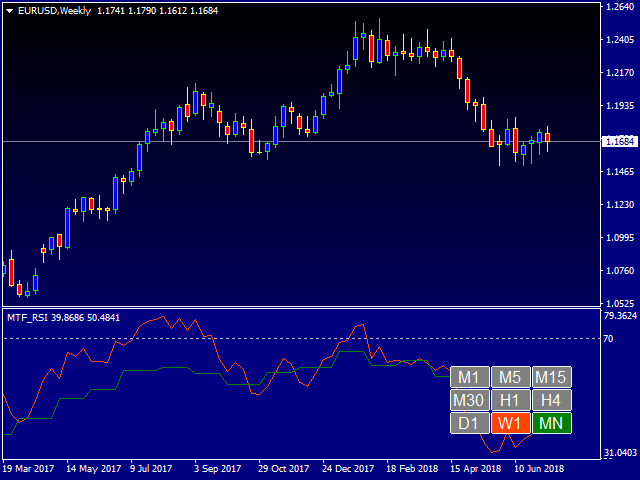
Este indicador está diseñado para controlar los niveles de RSI en los marcos temporales actuales y superiores. El panel de control es fácil de usar y consta de botones, con los que puede controlar la visualización de las líneas según los nombres de los botones. El color del botón coincide con el color de la línea.
Parámetros
"Parámetros del indicador principal "
- Período RSI - período promedio para el cálculo del índice (por defecto es 14);
- RSI Tipo de precio - precio utilizado para los cálculos (por defecto es el precio de Cierre);
" ___| Paleta de colores "
- Color deltexto - por defecto es Blanco;
- ColorM1 - color de la línea para el marco temporal M1 (por defecto es DodgerBlue);
- ColorM5 - color de línea para el marco temporal M5 (por defecto es Rojo);
- ColorM15 - color de línea para el timeframe M15 (por defecto es Lima);
- ColorM30 - color de línea para el marco temporal M30 (por defecto es Aqua);
- ColorH1 - color de la línea para el marco temporal H1 (por defecto es Naranja);
- ColorH4 - color de la línea para el marco temporal H4 (por defecto es Magenta);
- ColorD1 - color de la línea para el marco temporal D1 (por defecto es Azul Marino);
- ColorW1 - color de la línea para el marco temporal W1 (por defecto es NaranjaRojo);
- ColorMN - color de la línea para el marco temporal MN (por defecto es Verde);
Especifique el periodo de promedio para el cálculo del índice, y el indicador le mostrará el RSI en todos los periodos superiores. Alternativamente, puede configurar la visualización de los valores del índice de los marcos temporales requeridos.

El usuario no ha dejado ningún comentario para su valoración