Flat Market 5
- Indicadores
- Versión: 4.7
- Actualizado: 20 noviembre 2021
- Activaciones: 5

Un mercado plano puede referirse a unaoperación en la que el par de divisas no se ha movido significativamente hacia arriba o hacia abajo y , por lo tanto, no tiene grandes ganancias o pérdidas atribuidas a la posición de comercio de divisas. Por lo general, los operadores no operan cuando el mercado está plano.
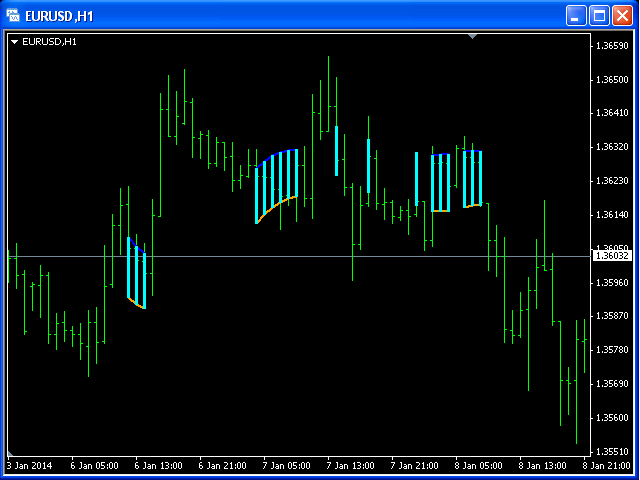
Este es un indicador que se explica por sí mismo - no hacer nada cuando el precio actual en una "nube".
Los parámetros de entrada nPeriod y nMethod se utilizan para el cálculo de las nubes aqua.