Bears Bulls Power Histograms
- Indicadores
- Versión: 2.15
- Activaciones: 5

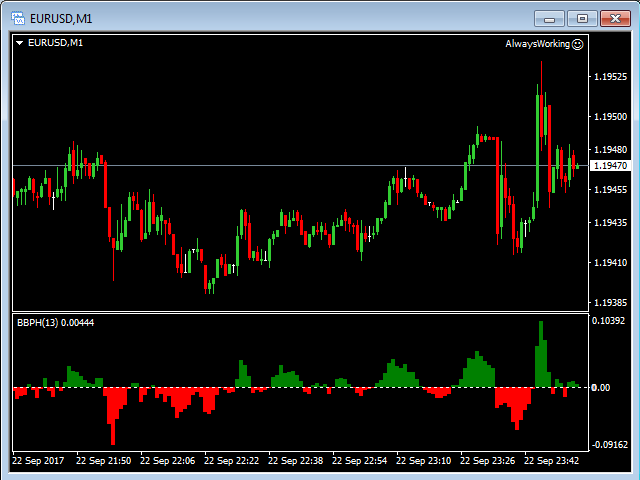
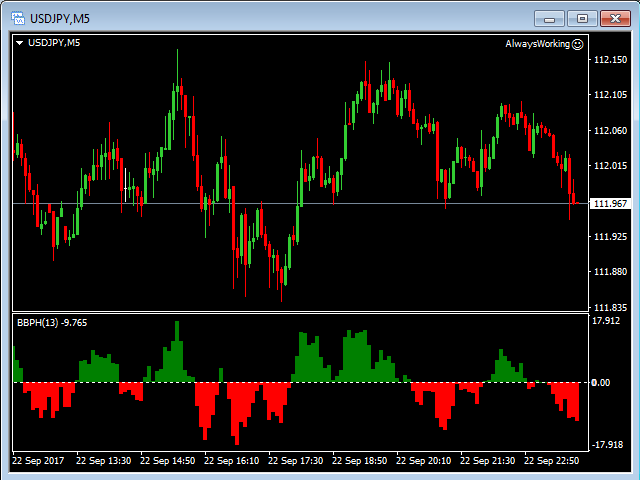
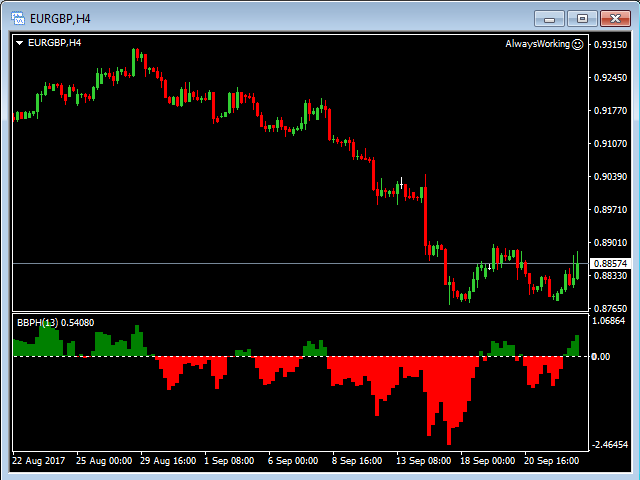
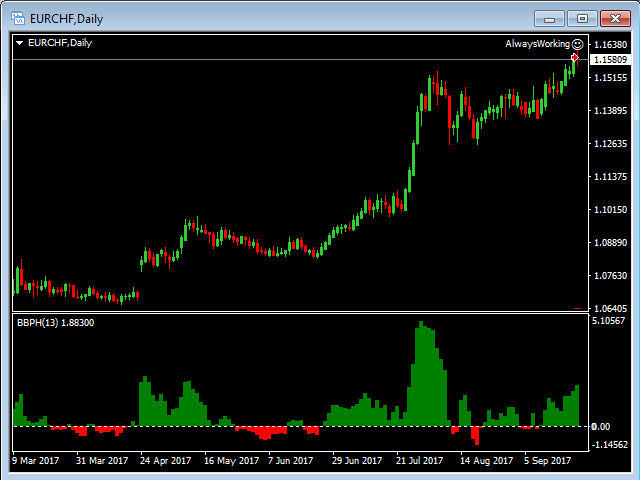
Este indicador funciona con cualquier instrumento financiero y período de tiempo.
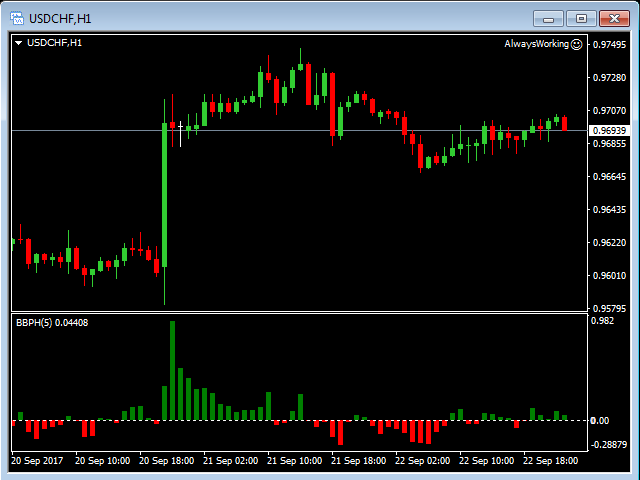
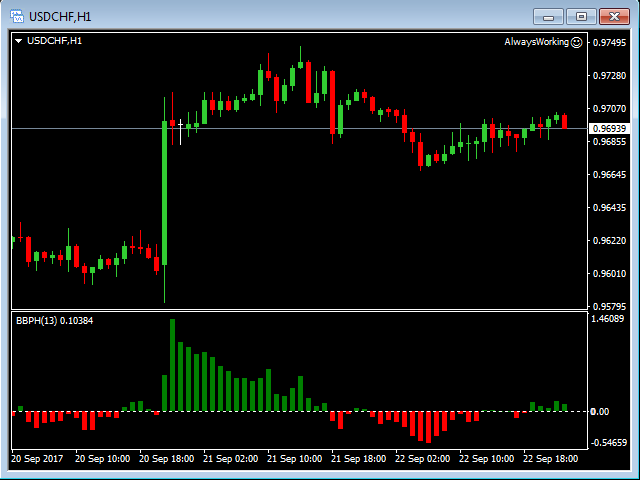
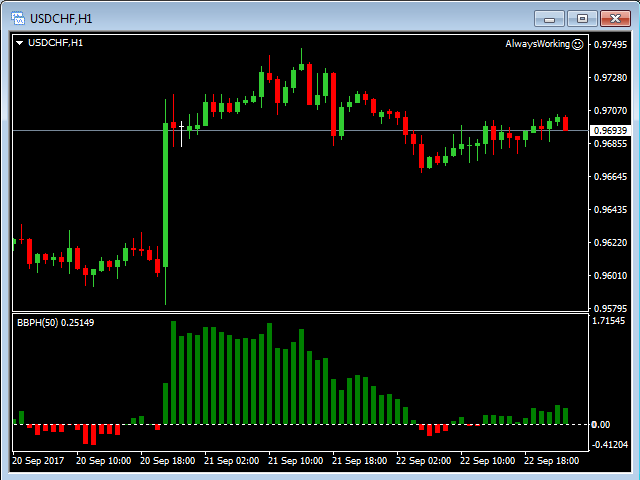
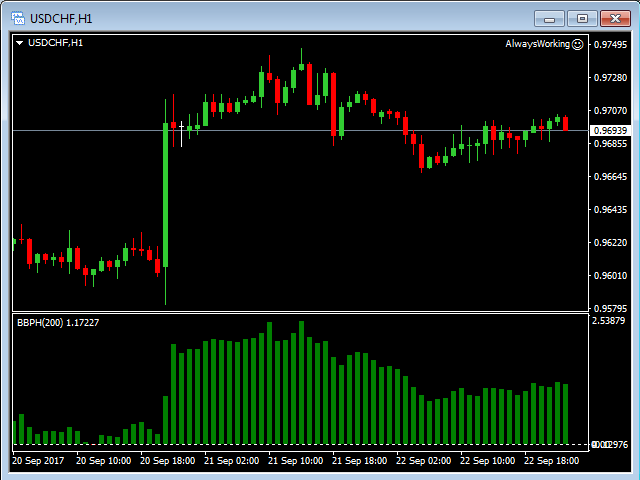
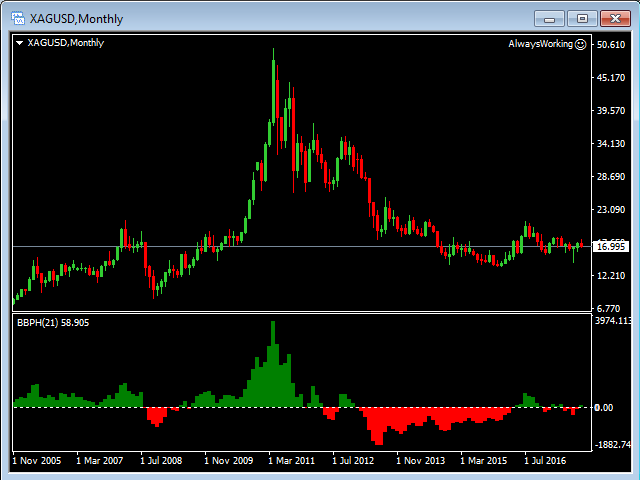
El indicador contiene sólo un parámetro: nBars - número de barras para el cálculo del valor del histograma.
Si un polo Verde se eleva desde un polo Rojo por encima de la línea cero, entonces se puede abrir una posición Larga.
Si un polo Rojo se eleva desde un polo Verde por debajo de la línea cero, entonces se puede abrir una posición Corta.
La altura de cada polo representa la Potencia de un movimiento Arriba/Abajo.
La transición de Rojo a Verde (y viceversa) muestra el cambio de tendencia.
Parámetros de Entrada:
- nBars - número de barras para el cálculo del valor del histograma.