High Volatility
- Indicadores
-
Chantal Sala
 Hi, I'm a programmer (female) from 1995 and in MQL4 from 2008.
I have released most of 2500 Expert Advisor/Indicators and Dashboard.
I have worked with many famous italian traders to automate their strategy. - Versión: 1.1
- Actualizado: 29 septiembre 2017
- Activaciones: 10
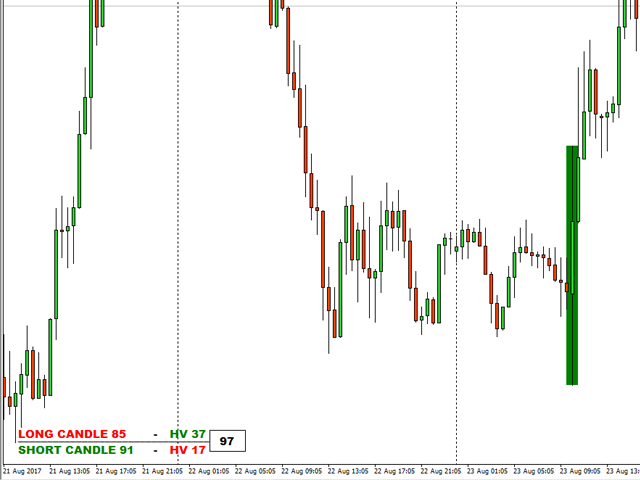
High Volatility es un indicador de utilidad que tiene la tarea de localizar velas volátiles.
La función de reconocimiento y recuento de velas alcistas y bajistas lo convierten en un excelente aliado para comprender la volatilidad del mercado.
Este punto suele definir posibles retrocesos y momentos de continuidad.
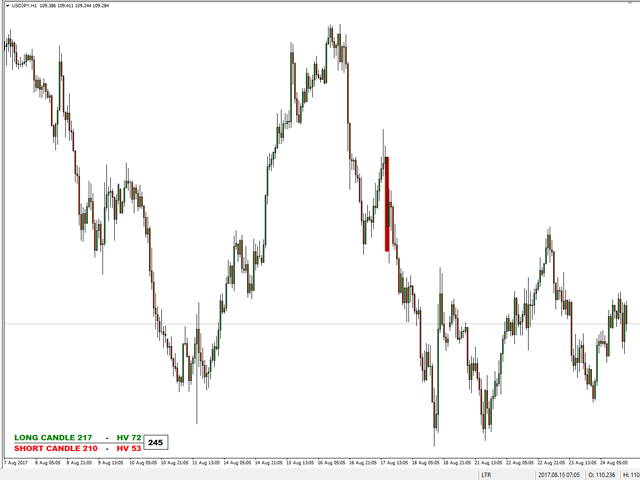
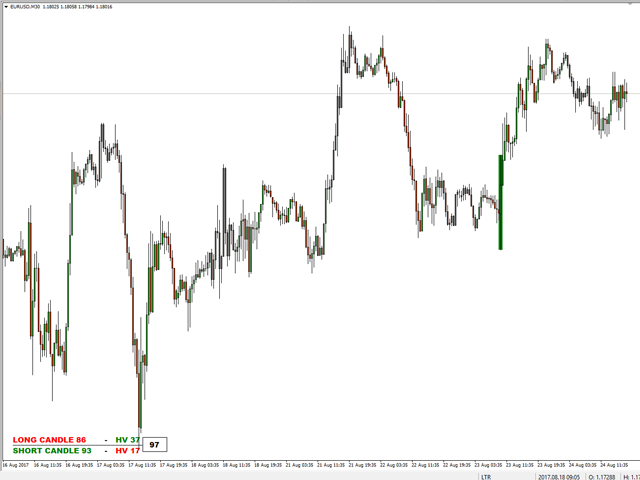
Se dibuja un rectángulo en el gráfico para identificar la vela con mayor volatilidad en largo y en corto.
Este indicador es muy eficaz para operar a corto, medio y largo plazo.
Una alerta le notificará cuando una nueva vela supere el último valor de Alta Volatilidad.
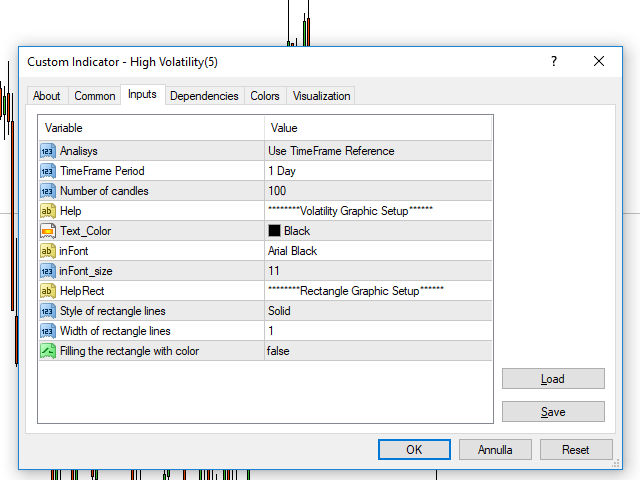
Valores de entrada
- Análisis
- Use Number of candles: el indicador usa el número de velas en el campo de análisis.
- Use TimeFrame Reference: el indicador usa las velas en el marco de tiempo elegido para el análisis.
- Período TimeFrame
- Número de velas
- Configuración del gráfico de volatilidad
- Color_texto
- inFont
- inFont_size
- Rectángulo Configuración gráfica
- Estilo de las líneas rectangulares
- Anchura de las líneas del rectángulo
- Rellenar el rectángulo con color
- Configuración de alertas
- PopUpMode (true/false) para activar o desactivar las alertas emergentes
- SoundMode (true/false) para activar o desactivar las alertas sonoras
- Sonido para elegir tu sonido favorito
- NotificationMode (true/false) para activar o desactivar las alertas push