Support and Resistance Scoreboard
- Indicadores
- Versión: 4.21
- Activaciones: 5

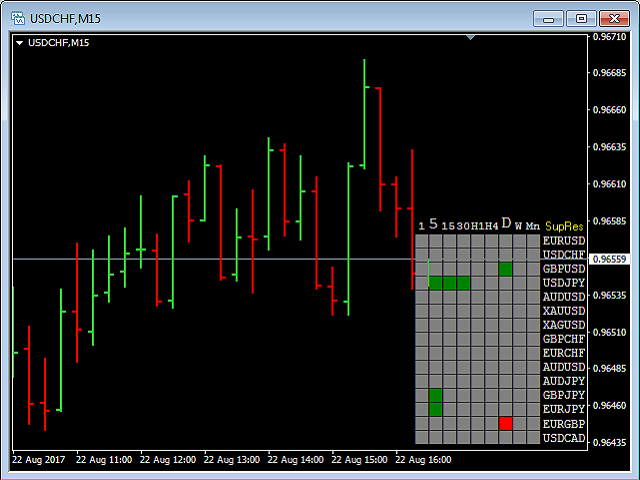
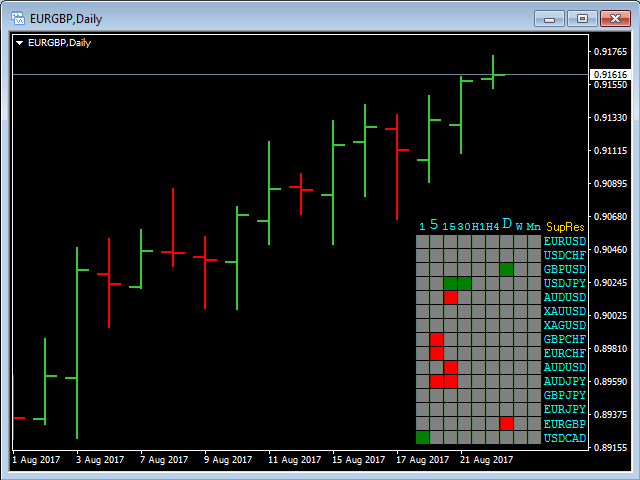
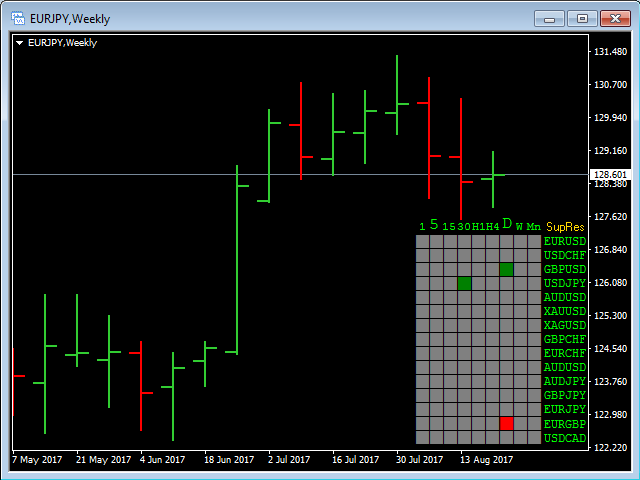
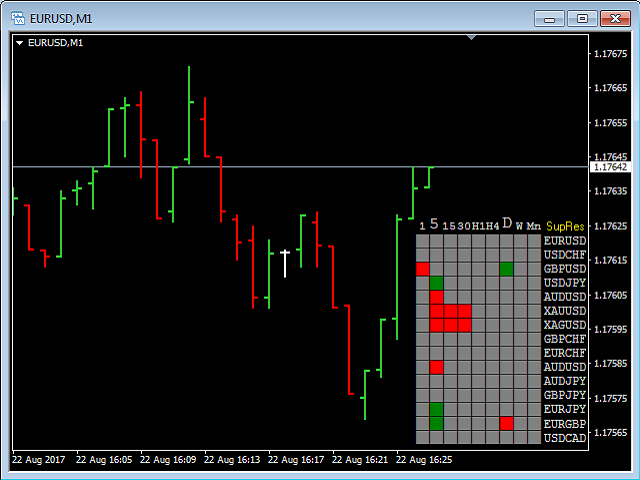
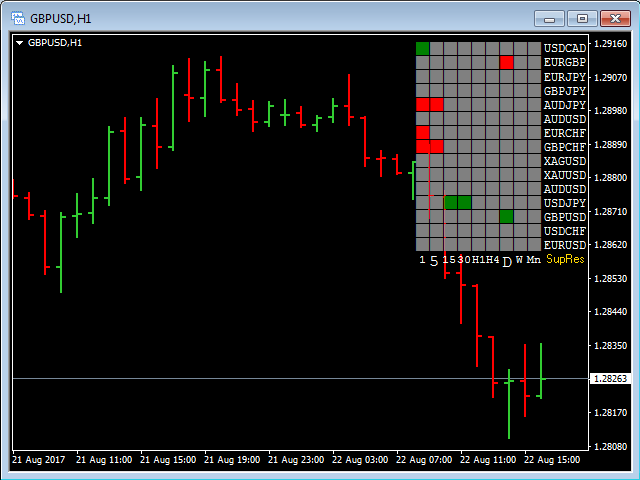
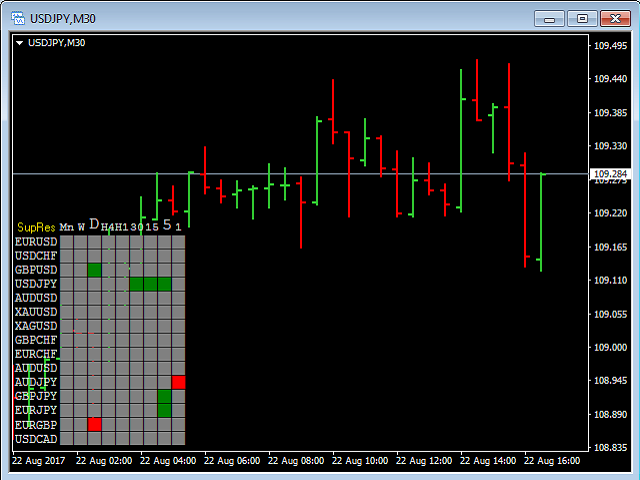
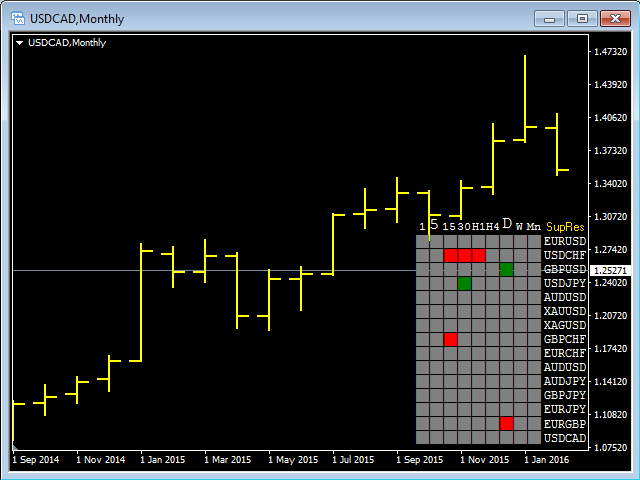
Este es un Indicador de Múltiples Marcos de Tiempo y Múltiples Pares de Divisas(Tablero de Puntuación) que muestra los Niveles de Soporte y Resistencia de todos los TFs para 15 pares de divisas a su elección.
La terminología de soporte se refiere a los precios en un gráfico que tienden a actuar como un piso al evitar que el precio de un activo sea empujado hacia abajo y puede ser una buena oportunidad de compra porque esta es generalmente el área donde los participantes del mercado ven un buen valor y comienzan a empujar los precios al alza de nuevo.
La terminología de resistencia se refiere a los precios en un gráfico que tienden a actuar como un techo al impedir que el precio de un activo sea empujado hacia arriba y puede ser una buena oportunidad de venta porque esta es generalmente el área donde los participantes del mercado ven un buen valor y comienzan a empujar los precios hacia abajo de nuevo.
El indicador de soporte-resistencia mostrará cuadrados rojos (oportunidad de compra) en caso de que el par de divisas esté alcanzando un nivel de resistencia para la TF actual y cuadrados verdes (oportunidad de venta) en caso de que el par de divisas esté alcanzando un nivel de soporte para la TF actual.
Parámetros de entrada
- Symb15 = "EURUSD"; - Símbolo #15;
- Symb14 = "USDCHF"; - Símbolo #14;
- Symb13 = "GBPUSD"; - Símbolo #13;
- Symb12 = "USDJPY"; - Símbolo #12;
- Symb11 = "AUDUSD"; - Símbolo #11;
- Symb10 = "USDCAD"; - Símbolo #10;
- Symb9 = "EURGBP"; - Símbolo #9;
- Symb8 = "EURJPY"; - Símbolo #8;
- Symb7 = "GBPJPY"; - Símbolo #7;
- Symb6 = "AUDJPY"; - Símbolo #6;
- Symb5 = "AUDUSD"; - Símbolo #5;
- Symb4 = "EURCHF"; - Símbolo #4;
- Symb3 = "GBPCHF"; - Símbolo #3;
- Symb2 = "XAGUSD"; - Símbolo #2;
- Symb1 = "XAUUSD"; - Símbolo #1;
- corner = CORNER_RIGHT_LOWER; - 1 de 4 posibles la posición del ScoreBoard;
- SymbColor = clrWhite; - uno de los muchos colores posibles para las etiquetas de TFs y Símbolos;
Nota
- Tiene que tener todos los datos de todos los TFs (al menos 50 Bares);
- Este indicador tiene un montón de memoria ... obviamente;
- Tener muchos buenos oficios ...


El usuario no ha dejado ningún comentario para su valoración