CME Daily Bulletin Open Interest MT4
- Indicadores
- Versión: 1.20
- Actualizado: 26 mayo 2020
- Activaciones: 5

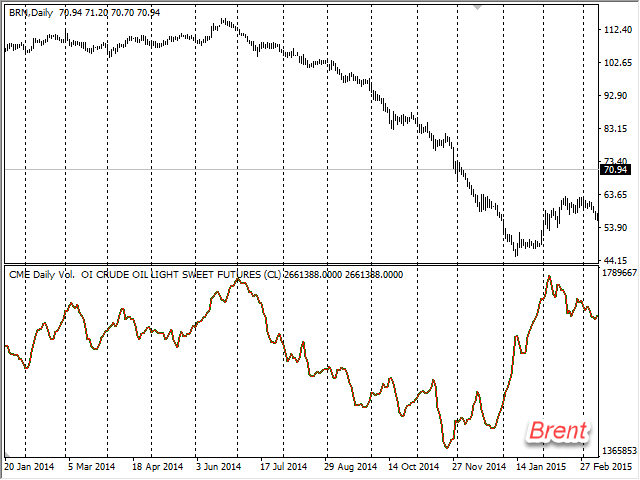
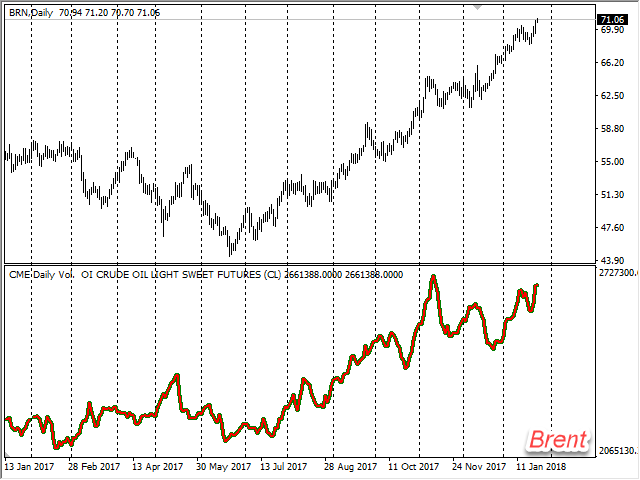
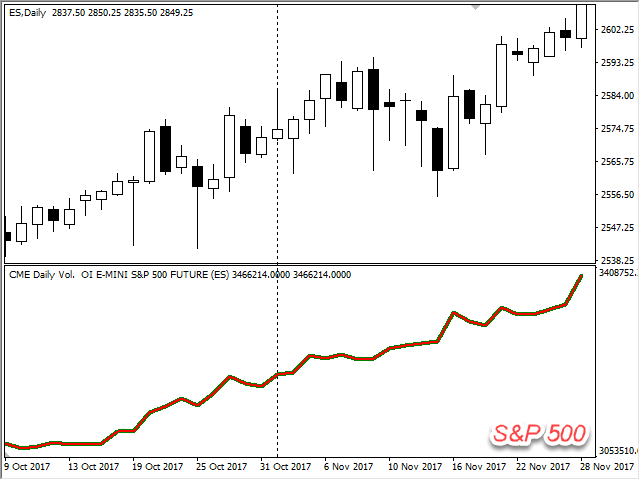
CME Daily Bullettin Open Interest proporciona los datos sobre el interés abierto de los contratos de futuros en el CME para sus gráficos. El interés abierto es un tipo especial de volumen, que muestra cuántos contratos están en manos de los participantes del mercado en cada momento. Este tipo de información sólo está disponible en los mercados de futuros. Pero ahora, con este indicador, también puede analizar estos datos cuando opere en los mercados al contado, como FOREX. Además, el indicador proporciona datos sobre el interés abierto para las opciones Call/Put de los contratos de futuros más comunes. Esto hace posible el cálculo de los indicadores de sentimiento no triviales, como Call/Put Ratio, Sentiment Accumulator, B&S Power Indicator y otros indicadores basados en el volumen real o el interés abierto.
A continuación se muestran los parámetros del indicador y sus valores:
- Auto Detect Report Name - detección automática del símbolo. Si este parámetro está activado, el indicador determina automáticamente el nombre del informe que debe cargarse para el símbolo actual;
- Nombredel Informe - nombre del informe que debe cargarse manualmente, en caso de que la autodetección del símbolo esté desactivada (ajustada a 'false');
- Frecuencia de actualización Mín - frecuencia de actualización de los datos. Si el valor es cero, los datos no se actualizan. El valor por defecto del parámetro es cero, lo que significa actualizar 1 vez por minuto.
Los datos sobre la cantidad de contratos abiertos se toman de una sección del "boletín diario" - informe de la CME, publicado semanalmente. Esta sección se llama "Volumen diario", está disponible como archivos Excel en el servidor ftp oficial de la bolsa. Para actualizar los datos sobre el interés abierto, basta con copiar los informes correspondientes en la carpeta de indicadores. Encontrará instrucciones detalladas para realizar la actualización en el blog Cómo actualizar los informes de CME en su PC. El modo de demostración (durante las pruebas) no necesita los datos, el indicador los carga desde su memoria interna. Sin embargo, la actualización de los informes no es posible en la versión de demostración, por lo tanto, el interés abierto en este modo se muestra con cierto retraso. El indicador funciona en cualquier marco temporal, pero los datos sólo están disponibles para el marco temporal diario; por lo tanto, el período gráfico de trabajo sugerido es D1. No obstante, siempre está disponible el interés abierto para el día de negociación en curso, que se actualiza varias veces durante la sesión de negociación.
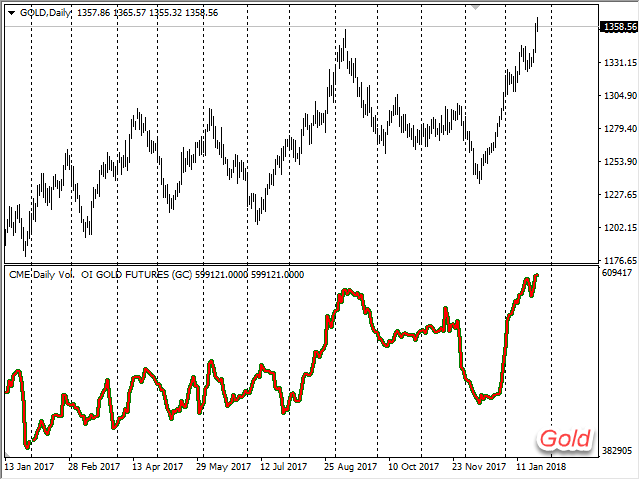
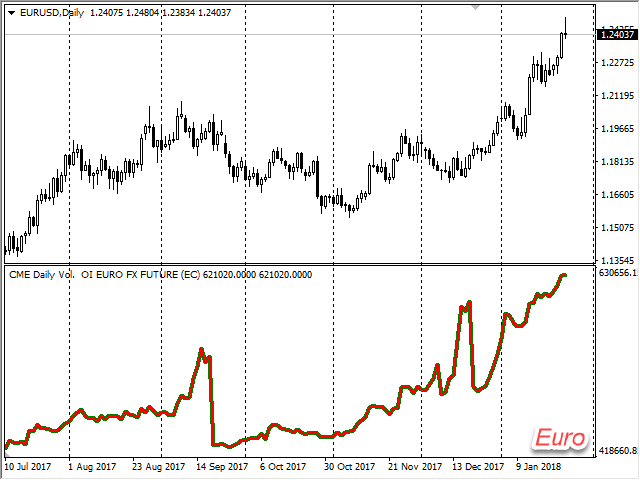
El indicador proporciona acceso al interés abierto de más de 800 mercados de futuros, incluido el mercado FOREX (EUR, GBP, CHF, JPY, CAD, AUD, NZD, RUB y algunos otros), metales (oro, plata, platino, etc.), energía (petróleo (varias variedades), gas). Índices (S&P 500, Dow Jones 30, Nasdaq-100, etc.). Instrumentos financieros: Bonos a 30 años, bonos del Tesoro a 10,5,2 años del gobierno federal. Materias primas (trigo, ganado de engorde y en pie, carne magra de porcino, madera, etc.). Sin embargo, algunos instrumentos poco comunes pueden no estar soportados en la versión demo. La lista completa de instrumentos compatibles está disponible en el blog: Lista completa de instrumentos financieros soportados de CME Daily Bulletin.