KT Volume Profile MT4
- Indicadores
-
KEENBASE SOFTWARE SOLUTIONS
 Keenbase Trading desarrolla indicadores profesionales y Asesores Expertos (Expert Advisors) para MetaTrader 4 y MetaTrader 5, diseñados para ayudar a los traders a tomar decisiones de trading más informadas.
 - Versión: 2.0
- Actualizado: 30 mayo 2022
- Activaciones: 5
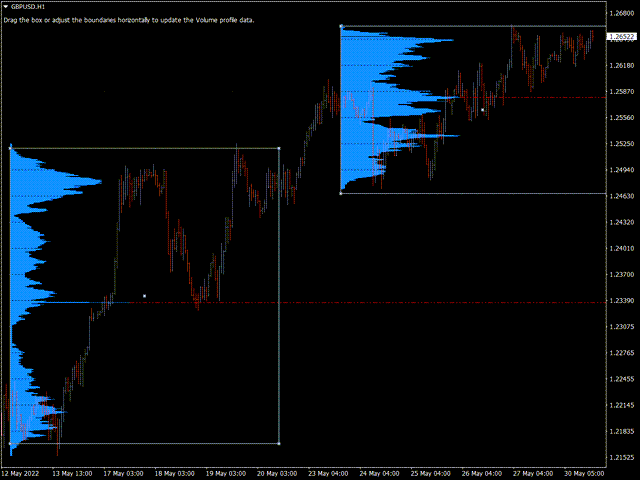
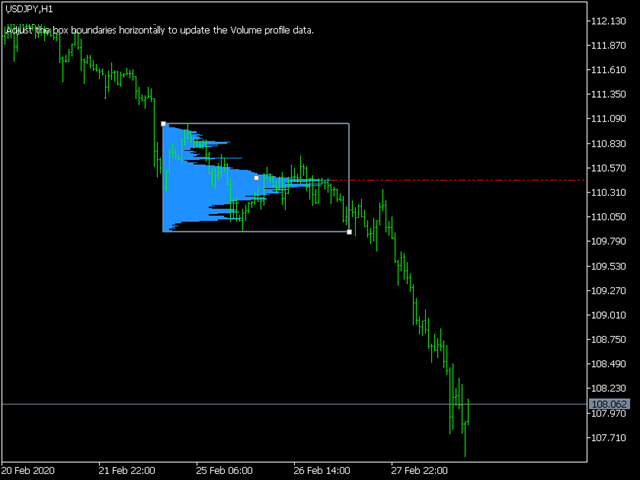
KT Volume Profile muestra los datos de acumulación de volumen como un histograma en el eje Y, lo que permite identificar la actividad de trading durante determinados períodos y niveles de precio.
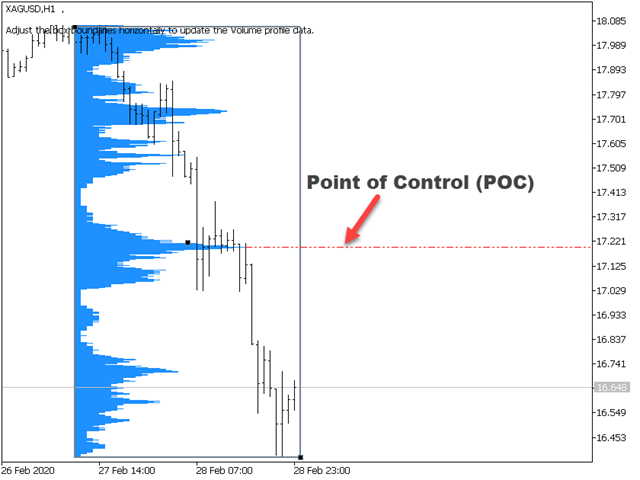
Punto de Control (POC) en un Perfil de Volumen
El POC representa el nivel de precio con mayor volumen negociado dentro del perfil de volumen. Suele utilizarse como soporte o resistencia, o como zona clave donde el mercado hace un retest antes de moverse en una dirección.
Características
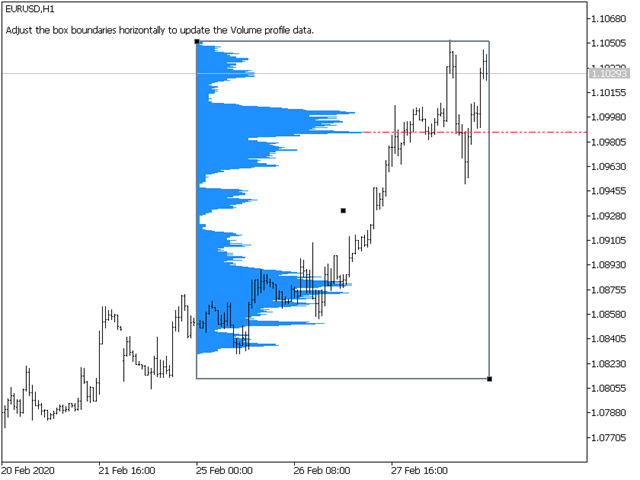
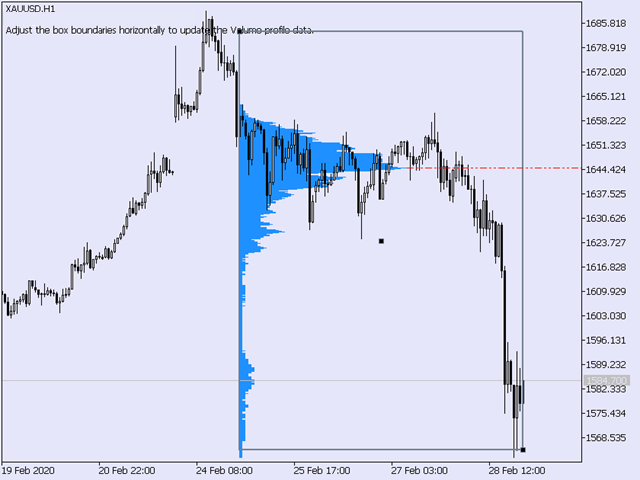
- Muy fácil de usar. Simplemente arrastra y suelta el rectángulo en el gráfico para actualizar el perfil de volumen en tiempo real.
- Puede generar alertas cuando el precio cruza el POC.
- Desarrollado desde cero, con uso mínimo de CPU y memoria.
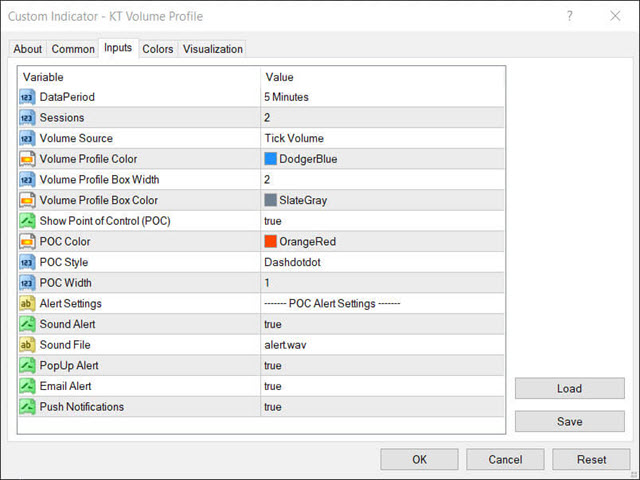
Parámetros de Entrada
- Fuente de Volumen: Volumen por tick / Volumen real.
- Color del Perfil de Volumen: Color del histograma del perfil.
- Ancho del Rectángulo: Ancho de la caja rectangular.
- Color del Rectángulo: Color de la caja rectangular.
- Mostrar POC: true/false
- Color del POC: Color del nivel POC.
- Estilo del POC: Estilo de la línea del POC.
- Grosor del POC: Ancho de la línea del POC.
- Ajustes de Alerta: Autoexplicativo.
Volumen Real vs Volumen por Tick
Obtener datos de volumen real es difícil para traders minoristas debido a la naturaleza descentralizada del mercado Forex. Si tu bróker proporciona volumen real, KT Volume Profile puede usarlo. De lo contrario, usará volumen por tick, que es común en la mayoría de brókers FX.
El trader profesional Caspar Marney presentó un estudio en 2011 que concluyó una alta correlación entre el volumen por tick y el volumen real.
El usuario no ha dejado ningún comentario para su valoración