AQ XFifteen Pro
- Indicadores
-
HIT HYPERTECH INNOVATIONS LTD
 We are a team of experts in Artificial Intelligence, Computational Finance & Finance with more than 25 years trading experience each, having worked in Hedge funds, big corporations, research institutes & academia. We operate from London, New York, Athens, Cyprus & are incorporated in Cyprus.
 - Versión: 1.0
- Activaciones: 5
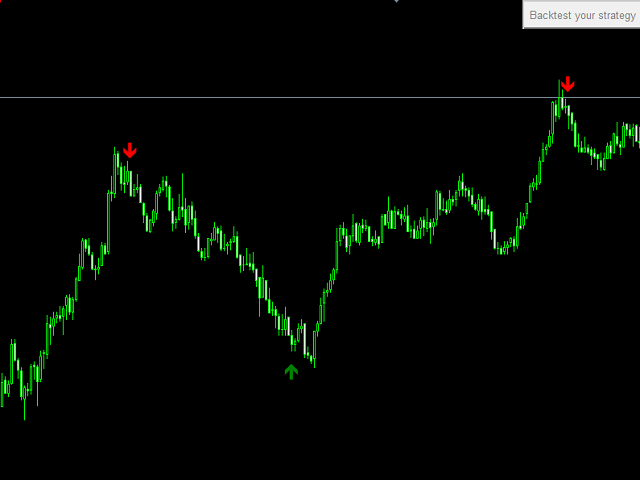
El indicador Χ15 es una herramienta de MetaTrader 4 que le permite CONSTRUIR Y COMPROBAR EN TIEMPO REAL sus propias estrategias de forma rápida, sencilla y eficaz. Contiene 15 de los indicadores de análisis técnico más populares que puede utilizar, cada uno de una manera diferente. Elija los indicadores que desea utilizar, seleccione cómo los utilizará y verá en el gráfico flechas de COMPRA (verde) y VENTA (rojo) implementando su estrategia. Elija Take Profit y Stop Loss y verá los resultados de su estrategia con ESTADÍSTICAS COMPLETAS DE BACKTEST de todas sus velas en el gráfico seleccionado.
Todos los indicadores están totalmente parametrizados por el usuario.
Todos los indicadores existen en la plataforma MetaTrader 4 del usuario, no es necesaria ninguna instalación especial.
En la versión pro, hemos mejorado seriamente el muy exitoso indicador X15 con un filtro único de Machine Learning que puede potenciar su estrategia. Construya su estrategia de acuerdo a sus reglas y dele un serio impulso activando el parámetro aQuantTrendOn. No importa cual sea la estrategia que construya (Seguimiento de Tendencia, Reversión, Breakout etc) el algoritmo a-Quant trend aumentará la rentabilidad la mayoría de las veces. Es muy fácil comprobarlo utilizando la herramienta de backtesting X15. La versión Pro también contiene la funcionalidad muy útil de Alertas que le notifican en cada señal que se produce.
Los indicadores son:
- Dos MAs, una rápida y una lenta con selección para usar la rápida, la lenta o rápida contra lenta
- RSI con selección para usar niveles de sobrecompra/sobreventa, rango RSI y RSI por encima/debajo de un valor crítico
- ADX con selección para utilizar el nivel crítico ADX, la tendencia ADX, +DI y -DI o todos los anteriores
- Estocástico con selección para utilizar el rango de valores del estocástico o el nivel de valor crítico
- MACD con selección por encima/por debajo de cero, por encima/por debajo de la señal MACD o ambos
- Volumen con selección por encima/por debajo de un nivel, volumen por encima/por debajo de la MA de Volumen o ambos
- Bandas de Bollinger con selección para utilizar el rango entre las bandas superior/inferior o para utilizar la banda media
- Heiken Ashi con selección del color de Heiken Ashi
- CCI con selección de los niveles de sobrecompra/sobreventa del CCI y CCI por encima/debajo de un nivel crítico
- Momentum con selección de la dirección del Momentum
- OSMA con selección por encima/por debajo de cero, dirección OSMA o ambas
- SAR parabólico con selección por encima/por debajo de puntos SAR
- Acelerador con selección por encima/por debajo de cero, dirección del Acelerador o ambas
- ATR con selección de la dirección del ATR
- Ichimoku con selección Chikou, Kumo, Kijun y Tenkan
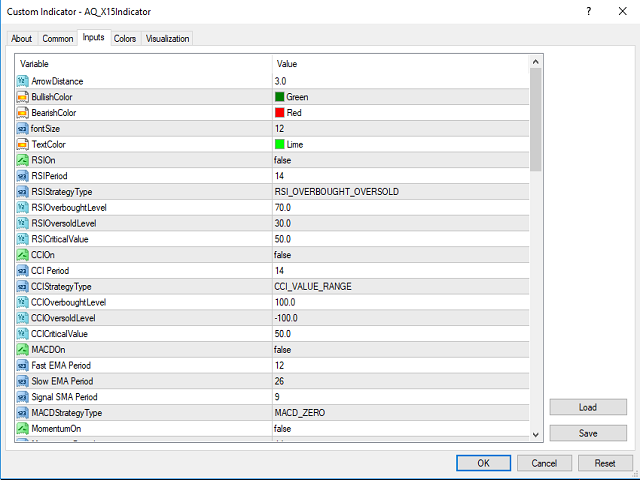
Parámetros
- ArrowDistance - distancia en pips de las flechas del indicador desde cada barra
- BullishColor - color para flechas alcistas/de compra
- BearishColor - color para flechas bajistas/de venta
- fontSize - tamaño de la fuente para probar los resultados en el gráfico
- TextColor - color del texto para los resultados de las pruebas en el gráfico
- RSIOn - true si desea incluir el indicador RSI en su estrategia
- RSIPeriod - periodo RSI
- RSIStrategyType
- RSI_OVERBOUGHT_OVERSOLD significa COMPRAR si el RSI está por debajo del nivel de sobrecompra del RSI y VENDER si el RSI está por encima del nivel de sobreventa del RSI.
- RSI_VALUE_RANGE significa COMPRAR si el RSI está entre los niveles de Sobrecompra y Sobreventa del RSI.
- RSI_VALUE_UP_DOWN significa COMPRAR si RSI está por encima del nivel crítico y VENDER si RSI está por debajo del nivel crítico
- RSIOverboughtLevel - Nivel de sobrecompra del RSI
- RSIOversoldLevel - Nivel de sobreventa del RSI
- RSICriticalValue - Nivel crítico del RSI