Effort and Result MT5 Indicator by PipTick
- Indicadores
-
Michal Jurnik
 "Talent is cheaper than table salt. What separates the talented individual from the successful one is a lot of hard work." - Stephen King. Those few words reflect myself very well. I am probably not the most talented developer in the world but I truly believe in hard work, professional attitude and
 - Versión: 1.1
- Actualizado: 1 diciembre 2021
- Activaciones: 5
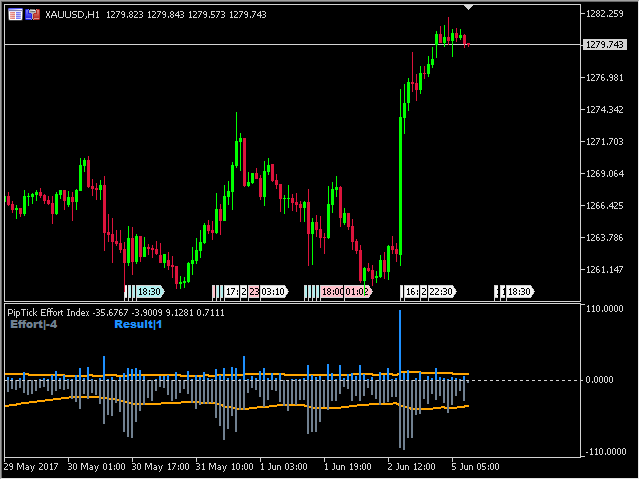
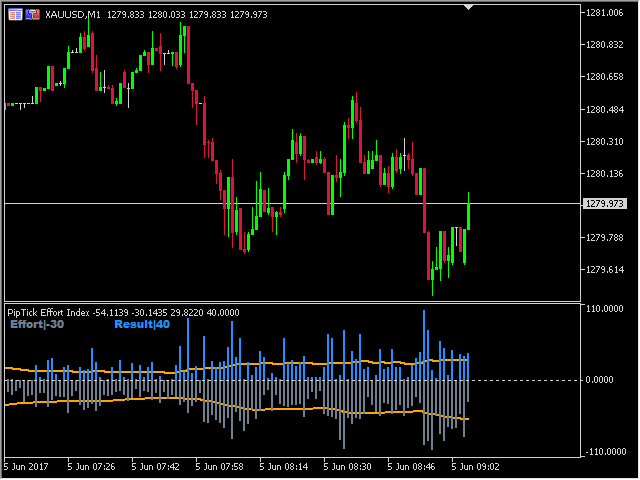
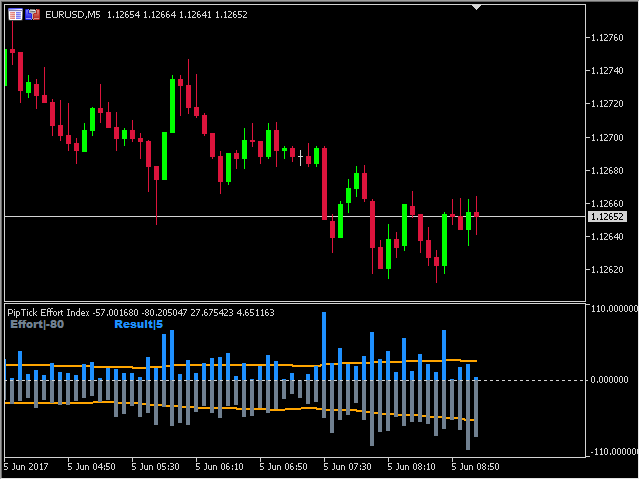
El indicador Esfuerzo y Resultado se basa en el trabajo de Karthik Marar; un operador de análisis de diferenciales de volumen.
Compara un cambio de precio (Resultado) con el tamaño del volumen (Esfuerzo) durante un periodo determinado.
Comparando el esfuerzo y el resultado, podemos obtener más información sobre el futuro movimiento del precio. Ambos valores se normalizan y se convierten a una escala de 0 - 100 % basada en un periodo retrospectivo seleccionable.
Este indicador también se conoce como Índice de Esfuerzo.
La ley del esfuerzo y el resultado
La ley del esfuerzo frente al resultado establece que el cambio en el precio de un vehículo comercial es el resultado de un esfuerzo expresado por el nivel de volumen y que la armonía entre esfuerzo y resultado promueve un mayor movimiento del precio. Por el contrario, la falta de equilibrio promueve un cambio de dirección.
Características principales
- El indicador compara el cambio en el precio (Resultado) con el tamaño del volumen (Esfuerzo).
- Funciona en todos los marcos temporales (M1, M5, M15, M30, H1, H4, D1, W1, MN).
- Preparado para backtesting (Sessions_Back personalizables).
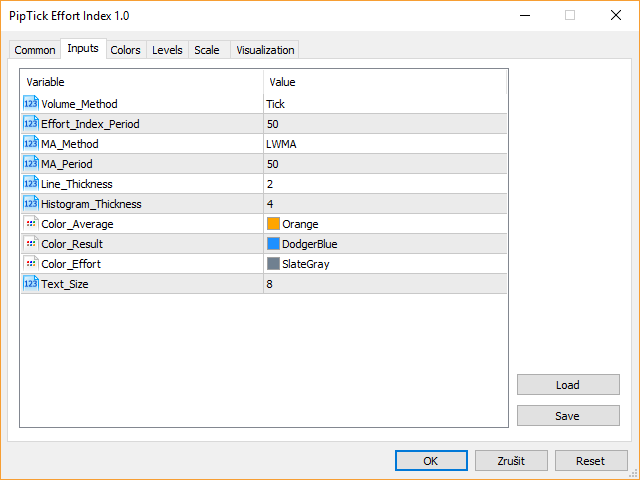
- Parámetros personalizables (colores, grosor de línea...).
- Alta velocidad de cálculo.
- Disponible para MT4 y MT5.
Por favor, visite la página del productoIndicador de Esfuerzo y Resultado para la configuración de los parámetros de entrada y salida.