Window Price Channel
- Indicadores
- Versión: 1.27
- Actualizado: 24 julio 2024
- Activaciones: 7

Descripción
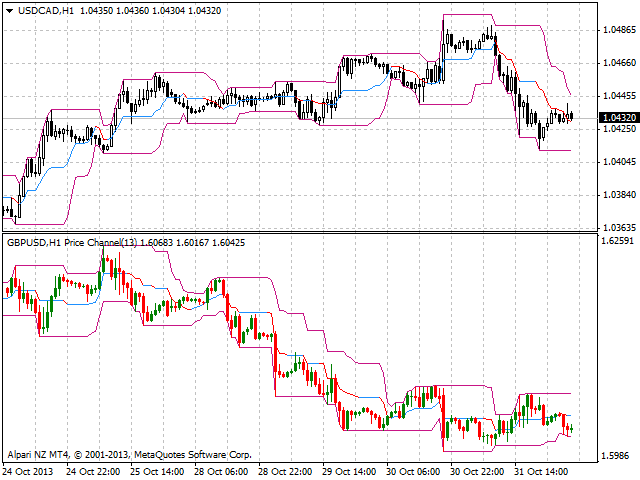
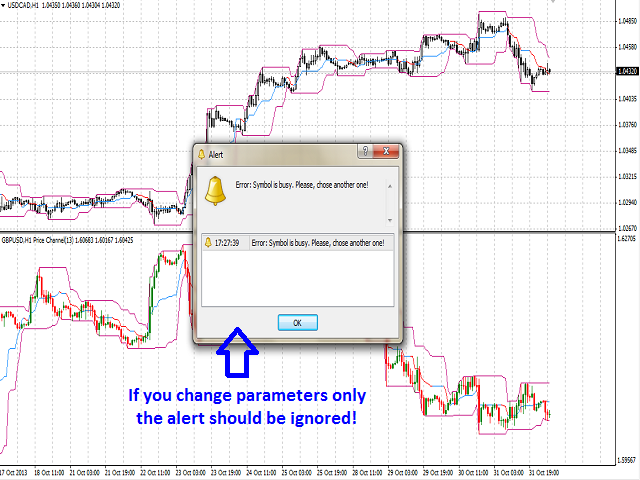
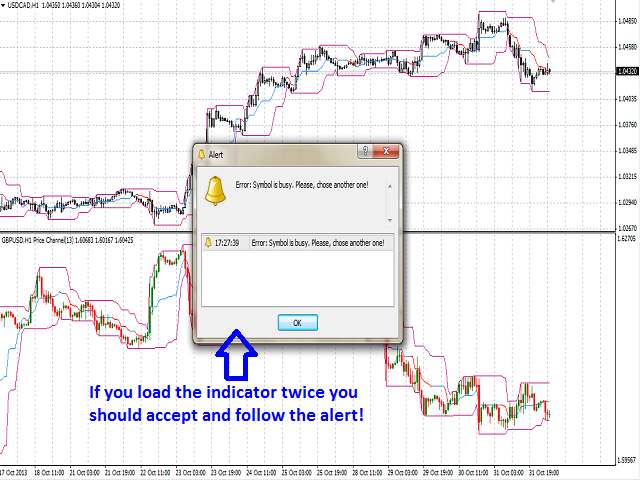
Un indicador de canal de color multidivisa/multisímbolo Window Price Channel para ser dibujado en una ventana de gráfico separada de un símbolo financiero.
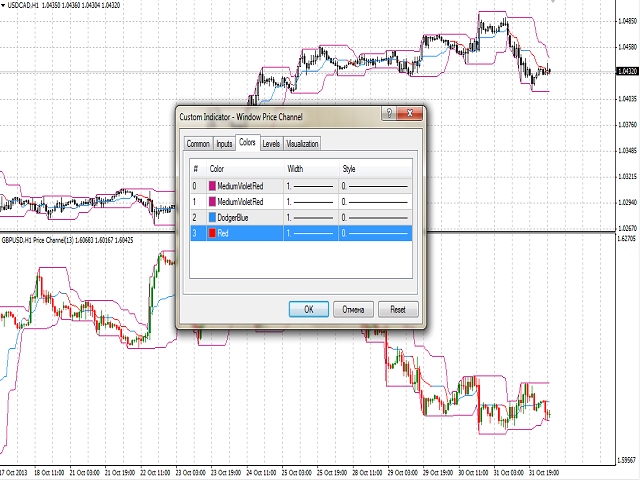
Puede colorear velas alcistas y bajistas y estados de ánimo basados en la línea media del indicador, así como cambiar el color de las líneas superior e inferior del canal.
Propósito
El indicador se puede utilizar para el comercio manual o automatizado en un Asesor Experto. Los valores de la memoria intermedia del indicador de tipo doble se pueden utilizar para el comercio automatizado:
- La línea media del indicador - buffer 4.
- La línea superior del indicador - buffer 0.
- La línea inferior del indicador - buffer 1.
- El ánimo alcista de la línea media - buffer 2, no debe ser igual a cero.
- El ánimo alcista de la línea media - buffer 3, no debe ser igual a cero.
Para un análisis más profundo el indicador puede ser utilizado en combinación con los indicadores Price Channel y/o Channel Global Multicurrency.
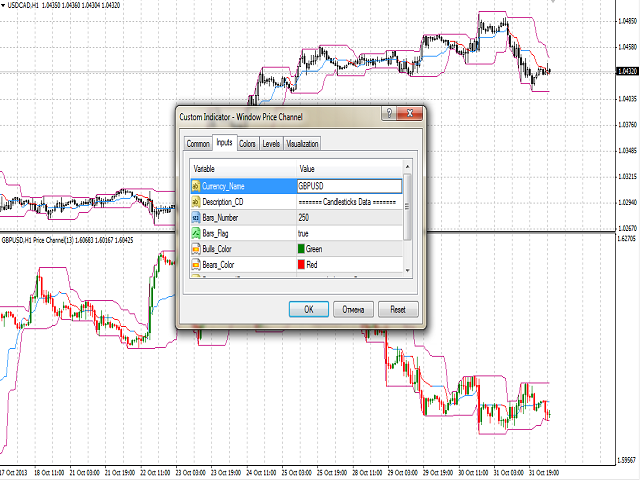
Entradas
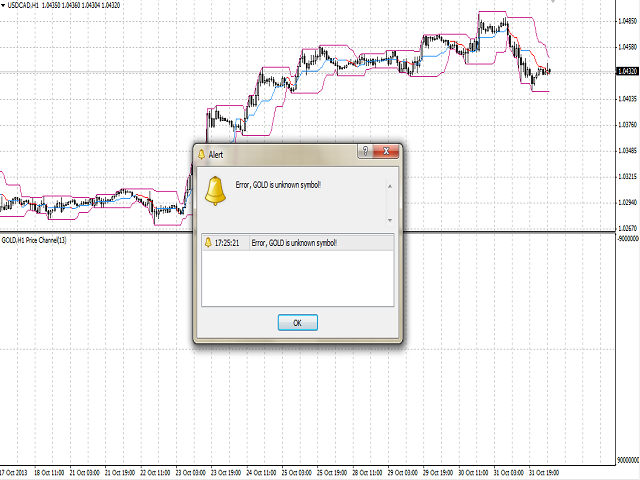
- Currency_Name - el nombre del instrumento financiero.
- Bars_Number - el número de barras que se mostrarán en una ventana separada.
- Bars_Flag - una bandera para permitir la visualización del número de barras especificado en el parámetro Bars_Number:
- true - según Bars_Number.
- false - máximo de barras disponibles en el historial.
- Bulls_Color - el color de la vela alcista.
- Bears_Color - color de la vela bajista.
- Bid_Line_Color - color de la línea Bid.
- Channel_Period - periodo de cálculo del indicador.