Color Price Channel
- Indicadores
- Versión: 1.22
- Actualizado: 11 abril 2020
- Activaciones: 8

Descripción
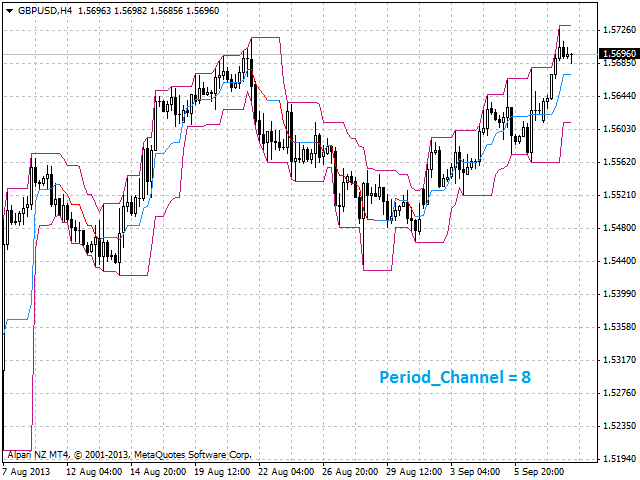
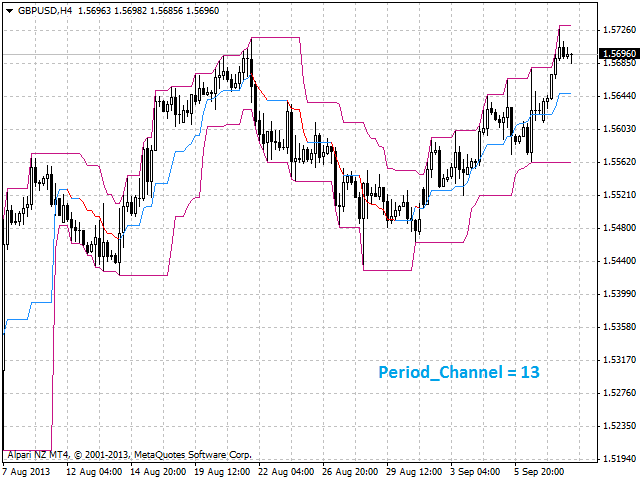
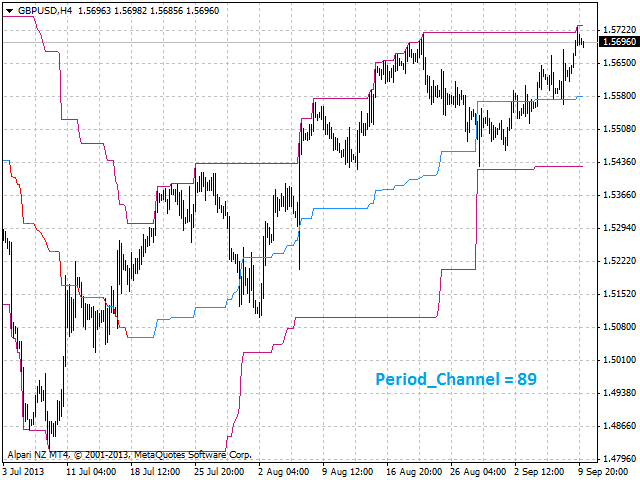
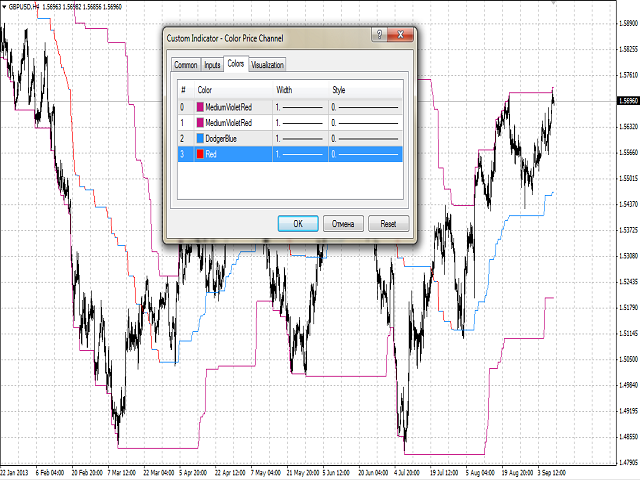
Un indicador de canal de color Price Channel para ser dibujado en el gráfico principal de un símbolo financiero.
Puede colorear los estados de ánimo alcistas y bajistas basándose en la línea media del indicador, así como cambiar el color de las líneas superior e inferior del canal.
Propósito
El indicador se puede utilizar para el comercio manual o automatizado en un Asesor Experto. Los valores de la memoria intermedia del indicador de tipo doble se pueden utilizar para el comercio automatizado:
- La línea media del indicador - buffer 4.
- La línea superior del indicador - buffer 0.
- La línea inferior del indicador - buffer 1.
- El ánimo alcista de la línea media - buffer 2, no debe ser igual a cero.
- El ánimo alcista de la línea media - buffer 3, no debe ser igual a cero.
Para un análisis más profundo el indicador puede ser utilizado en combinación con el indicador Channel Global Multicurrency del gráfico secundario.
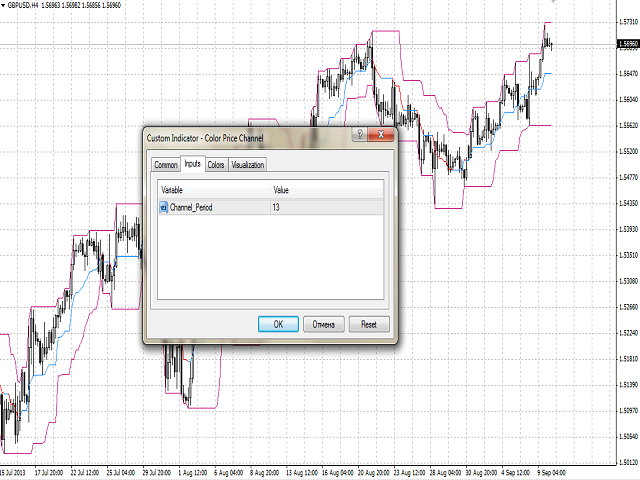
Entradas
- Channel_Period - el período de cálculo del indicador.