Color Chart MAs
- Indicadores
- Versión: 1.23
- Actualizado: 23 julio 2024
- Activaciones: 7

Descripción
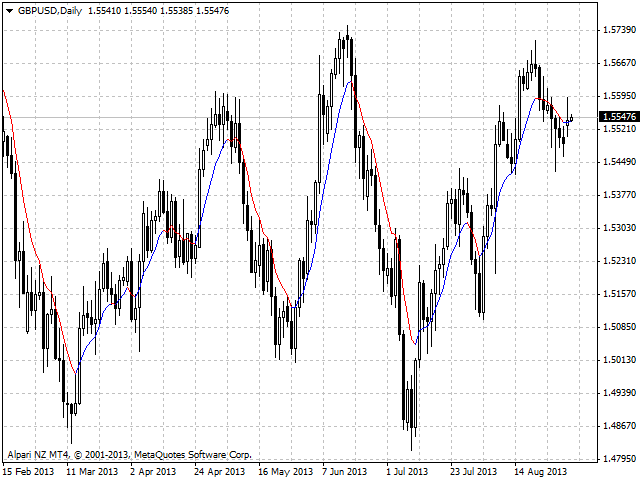
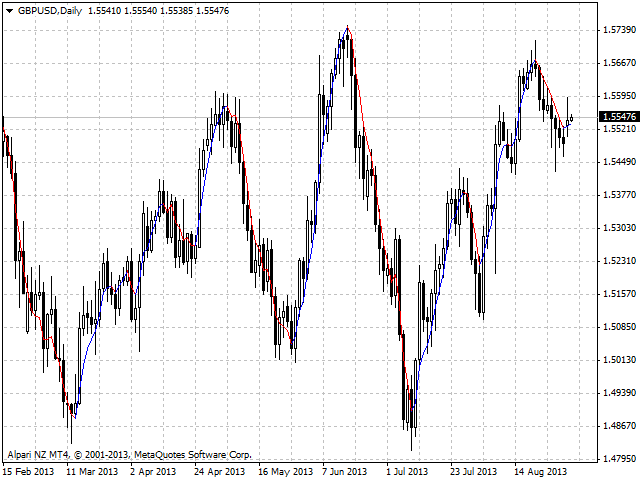
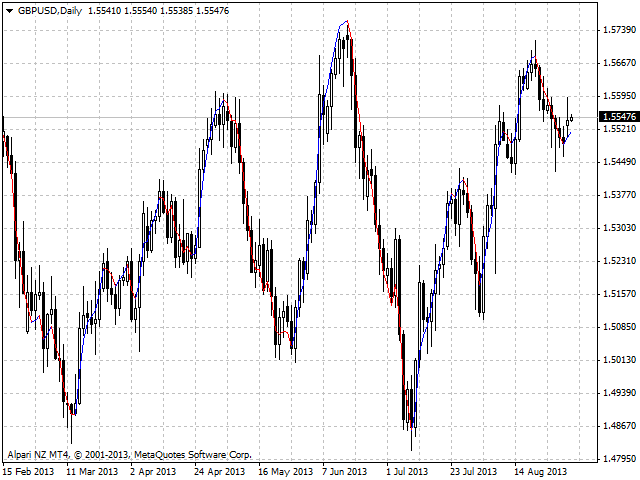
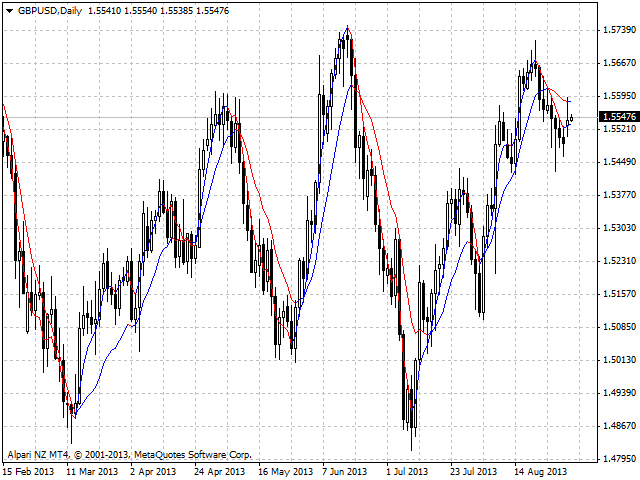
Un indicador universal coloreado de medias móviles: Media móvil, Media móvil doble, Media móvil triple.
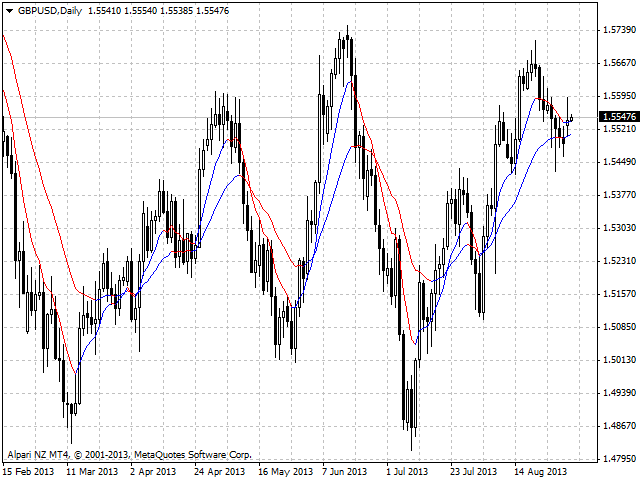
El indicador ofrece varias oportunidades para el análisis de precios basado en diferentes formas de construcción de medias móviles en la ventana del instrumento financiero principal.
Puede colorear las medias móviles alcistas y bajistas.
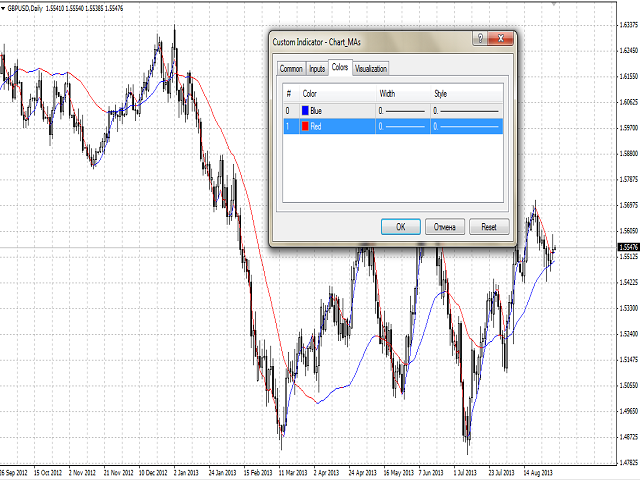
Entradas
- MA_Type - tipo de multiplicidad:
- Media Móvil.
- Media Móvil Doble.
- Media Móvil Triple.
- MA_Period - el periodo de la MA.
- MA_Method - el método de promediación para la MA.
- Applied_Price - precio utilizado.
- Shift - desplazamiento relativo al gráfico de precios.
Propósito
El indicador se puede utilizar para el comercio manual o automatizado en un Asesor Experto. Los valores de los búferes del indicador de tipo doble se pueden utilizar para el comercio automatizado:
- La línea principal del indicador - buffer 5.
- La línea alcista del indicador - buffer 0, no debe ser igual a 0.
- La línea bajista del indicador - buffer 1, no debe ser igual a cero.