Reversal Bars
- Indicadores
- Versión: 1.22
- Actualizado: 23 julio 2024
- Activaciones: 7

Descripción
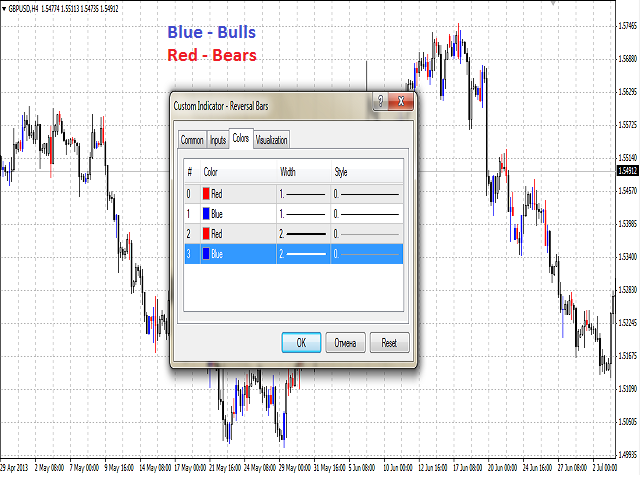
El indicador determina la aparición de las barras que señalan una inversión del estado de ánimo local actual y emite un pitido. También pinta estas barras de acuerdo con la prioridad alcista y/o bajista.
Puede seleccionar el color para los estados de ánimo alcistas y bajistas.
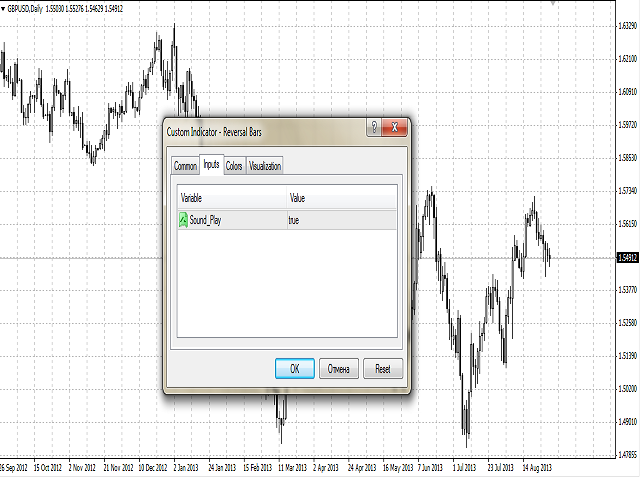
Entradas
- Sound_Play - una bandera que permite la notificación sonora.
Utilice
La detección de la barra de reversión puede ser una señal para realizar actividades comerciales apropiadas.
El indicador se puede utilizar para el comercio manual o automatizado en un Asesor Experto. Para el comercio automatizado puede utilizar valores de cualquier búfer indicador de tipo doble: 0, 1, 2 o 3. ¡El valor no debe ser cero!