Window Price Channel
- Indikatoren
- Version: 1.27
- Aktualisiert: 24 Juli 2024
- Aktivierungen: 7

Beschreibung
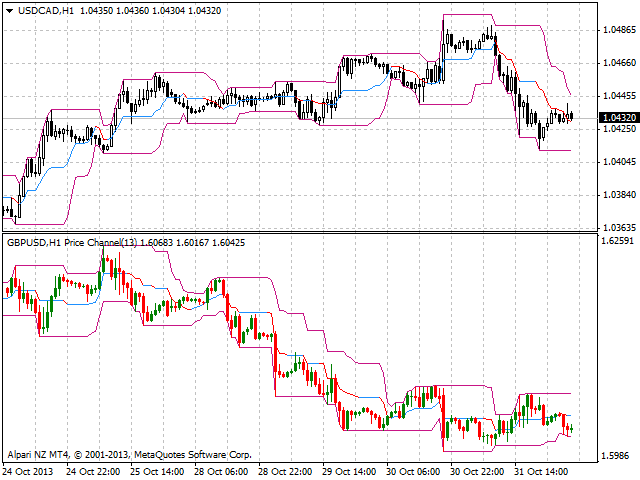
Ein farbiger Multicurrency/Multisymbol-Kanal-Indikator Window Price Channel, der auf einem separaten Chart-Fenster eines Finanzsymbols gezeichnet wird.
Er kann bullische und bearische Candlesticks und Stimmungen basierend auf der Mittellinie des Indikators einfärben, sowie die Farbe der oberen und unteren Linie des Kanals ändern.
Zweck
Der Indikator kann für den manuellen oder automatisierten Handel in einem Expert Advisor verwendet werden. Die Werte des Indikatorpuffers vom Typ Double können für den automatisierten Handel verwendet werden:
- Die mittlere Linie des Indikators - Puffer 4.
- Die obere Linie des Indikators - Puffer 0.
- Die untere Linie des Indikators - Puffer 1.
- Die bullische Stimmung der mittleren Linie - Puffer 2, darf nicht gleich Null sein.
- Die bullische Stimmung der mittleren Linie - Puffer 3, darf nicht gleich Null sein.
Für eine tiefer gehende Analyse kann der Indikator in Kombination mit dem Price Channel und/oder dem Channel Global Multicurrency Indikator verwendet werden.
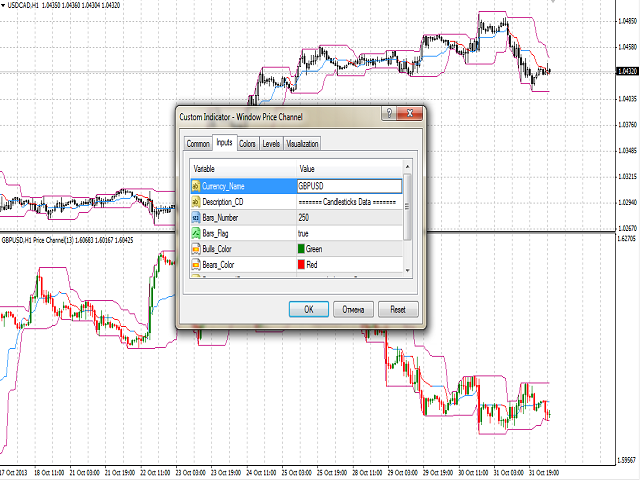
Eingaben
- Währung_Name - der Name des Finanzinstruments.
- Bars_Number - die Anzahl der Bars, die in einem separaten Fenster angezeigt werden sollen.
- Bars_Flag - ein Flag, das die Anzeige der im Parameter Bars_Number angegebenen Anzahl von Bars erlaubt:
- true - entsprechend Bars_Number.
- false - maximal verfügbare Balken in der Historie.
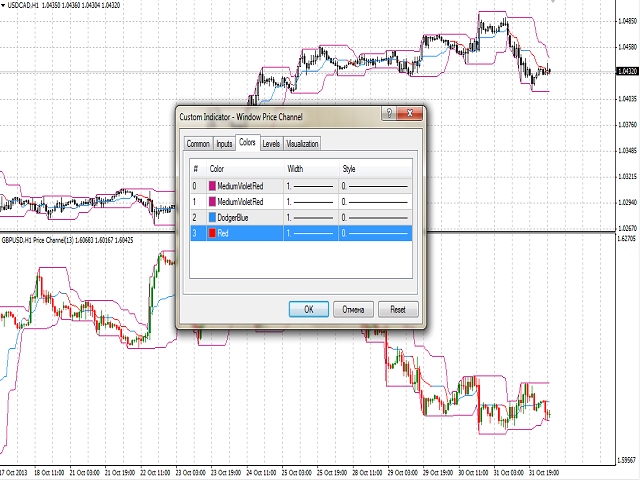
- Bulls_Color - die Farbe des bullischen Candlesticks.
- Bears_Color - die Farbe der bearish candlestick.
- Bid_Line_Color - Farbe der Bid-Linie.
- Channel_Period - der Berechnungszeitraum des Indikators.