Multicurrency MAs
- Indicadores
- Versión: 1.24
- Actualizado: 23 julio 2024
- Activaciones: 7

Descripción
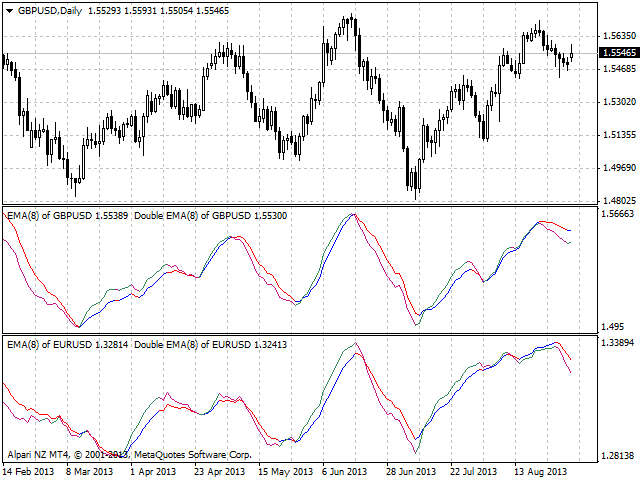
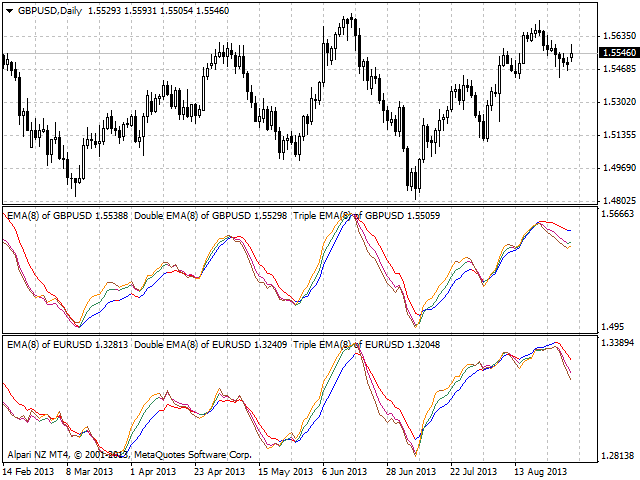
Un indicador universal coloreado multidivisa/multisímbolo de medias móviles: Media Móvil, Media Móvil Doble, Media Móvil Triple.
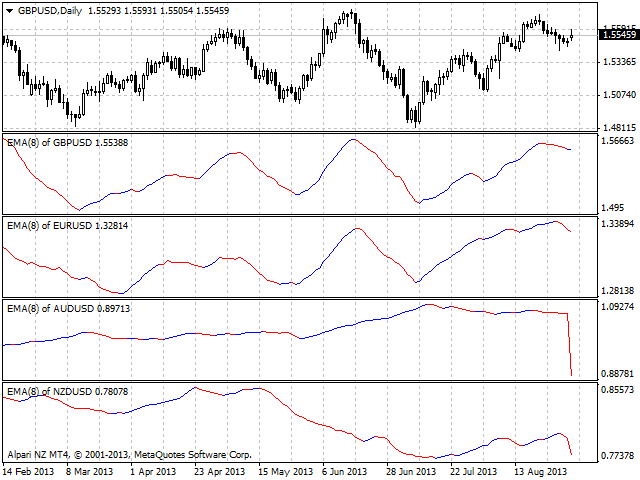
El indicador se dibuja en una ventana separada, por lo que debajo del gráfico de negociación principal un usuario puede ver el desarrollo de otro instrumento financiero.
Es muy útil cuando se consideran los valores combinados de varias medias móviles para diferentes instrumentos financieros debajo del gráfico principal de negociación.
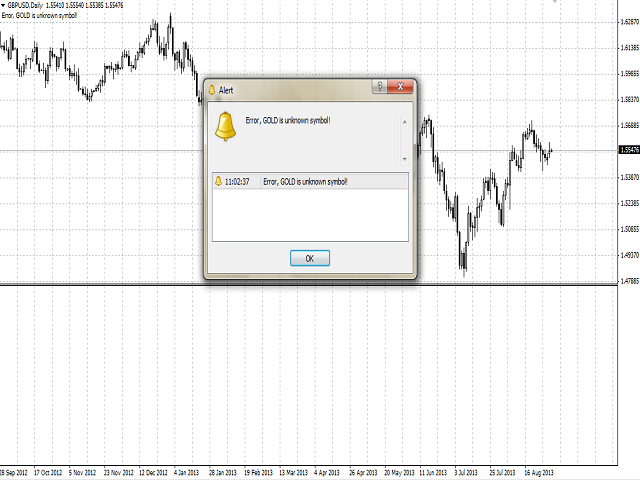
El indicador puede utilizarse con cualquier broker, independientemente del nombre del instrumento financiero, ya que es necesario introducir manualmente el nombre como parámetro de entrada. Si introduce un nombre inexistente o incorrecto de un instrumento financiero, recibirá un mensaje de error que indica que este instrumento financiero es desconocido (no existe).
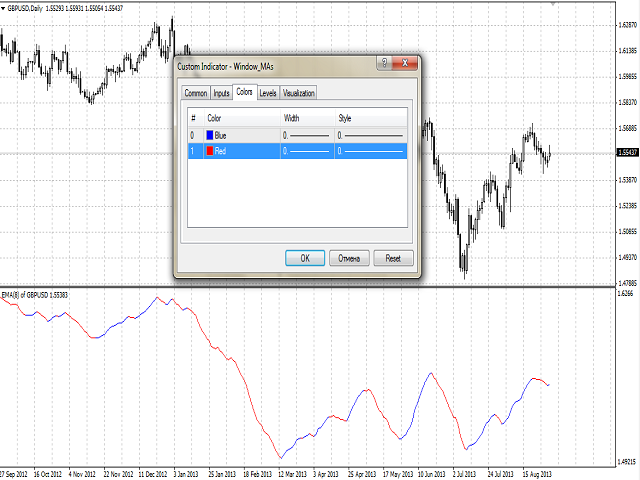
Puede colorear estados de ánimo alcistas y bajistas.
Entradas
- Currency_Name - nombre del instrumento financiero.
- MA_Type - tipo de multiplicidad:
- Media Móvil.
- Media Móvil Doble.
- Media Móvil Triple.
- MA_Period - el periodo de la MA.
- MA_Method - el método de promediación para la MA.
- Applied_Price - precio utilizado.
- Shift - desplazamiento relativo al gráfico de precios.
Propósito
El indicador se puede utilizar para el comercio manual o automatizado en un Asesor Experto. Los valores de los búferes del indicador de tipo doble se pueden utilizar para el comercio automatizado:
- La línea principal del indicador - buffer 5.
- La línea alcista del indicador - buffer 0, no debe ser igual a 0.
- La línea bajista del indicador - buffer 1, no debe ser igual a cero.