CCI Global
- Indicadores
- Versión: 1.23
- Actualizado: 18 julio 2024
- Activaciones: 7

Descripción
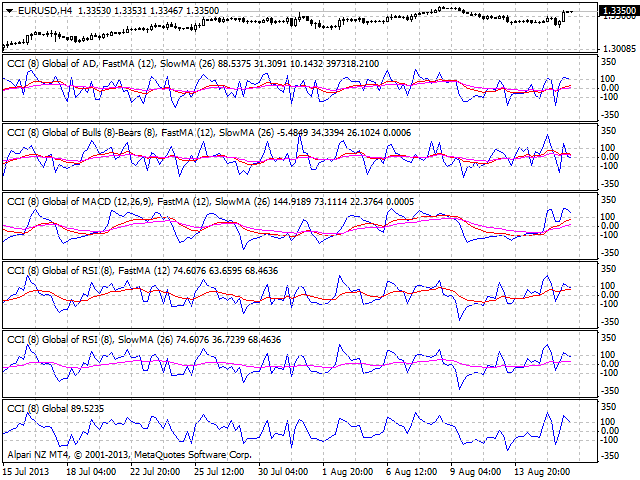
Un indicador universal CCI junto con medias móviles basadas en él. Dependiendo de la necesidad, las medias móviles pueden ser desactivadas.
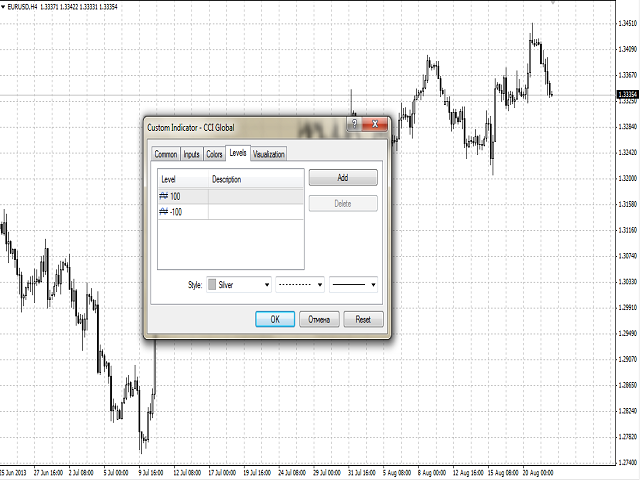
Se puede colorear las líneas y niveles del indicador: líneas de CCI, líneas de medias móviles y umbrales de niveles de sobrecompra y sobreventa.
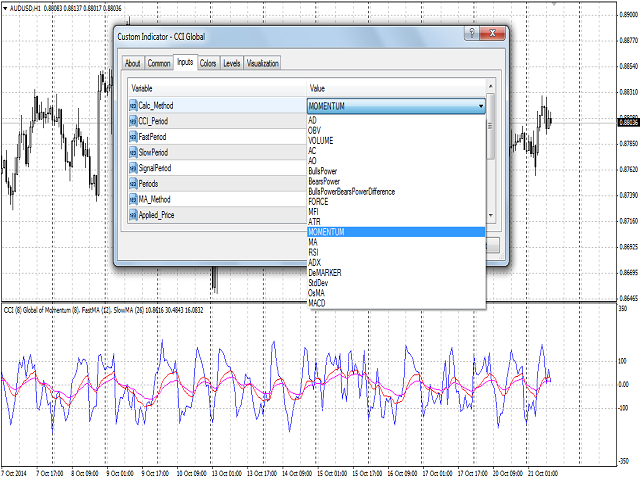
El indicador puede ser calculado como el estándar sobre la base de un precio o como un derivado sobre la base de los siguientes dieciocho otros indicadores incluidos en el paquete estándar del terminal MetaTrader 4:
- AD - indicador de acumulación y distribución de volumen.
- OBV - volumen en balance.
- Volume - indicador de volumen de ticks.
- AC - indicador de aceleración.
- AO - oscilador de Williams.
- BullsPower.
- BearsPower.
- BullsPower-BearsPower - diferencia entre el bulls power y el bears power.
- Force - Indicador del índice de fuerza.
- MFI - Índice de flujo monetario.
- ATR - Average True Range.
- Momentum.
- Media móvil.
- RSI - Índice de Fuerza Relativa.
- ADX - Indicador de movimiento direccional medio.
- DeMarker.
- Desviación estándar.
- OsMA - media móvil del oscilador.
- MACD - media móvil de convergencia/divergencia.
Por defecto se utiliza el precio.
Propósito
El indicador puede ser utilizado para el comercio manual o automatizado en un Asesor Experto. Los valores de los búferes del indicador de tipo doble se pueden utilizar para el trading automatizado:
- La línea CCI - buffer 0.
- Línea MA rápida - buffer 1.
- Línea MA lenta - buffer 2.
Entradas
- Calc_Method - el indicador, basado en el cual el CCI será calculado.
- CCI_Period - el periodo del indicador CCI.
- Periods - el periodo para calcular el indicador básico, basado en el cual se calculará el CCI.
- FastPeriod - el periodo MA rápido del indicador básico (por ejemplo MACD), basado en el cual se calculará el CCI.
- SlowPeriod - el periodo MA lento del indicador básico.
- SignalPeriod - el período de la línea de señal del indicador básico.
- MA_Method - método de promediación para la MA del indicador básico y para MAs.
- 8. Applied_Price - el precio utilizado del indicador básico.
- 9. Mode - el índice de la línea (MAIN o SIGNAL) del indicador básico, en base al cual se calculará el CCI.
- Shift - el desplazamiento del indicador básico con respecto al gráfico de precios.
- FastMA_Draw - el criterio de uso en los cálculos y el dibujo de la MA rápida.
- SlowMA_Draw - el criterio de uso en los cálculos y el dibujo de la lenta MA.

Реально отличный индикатор. Синергия в чистом виде.
Автору большое спасибо.