Main Candles
- Indicadores
- Versión: 1.21
- Actualizado: 31 marzo 2020
- Activaciones: 5

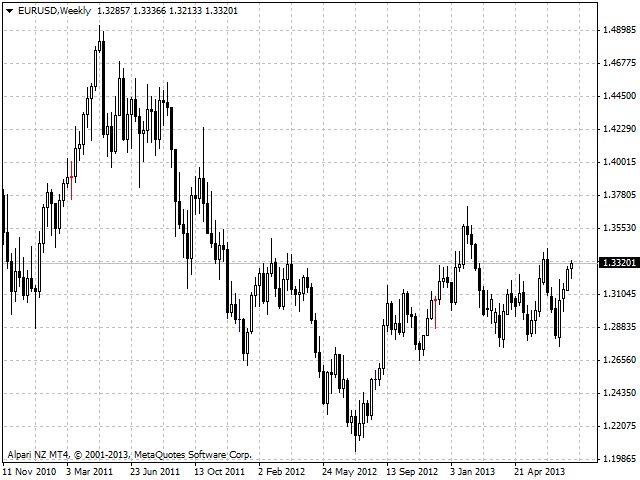
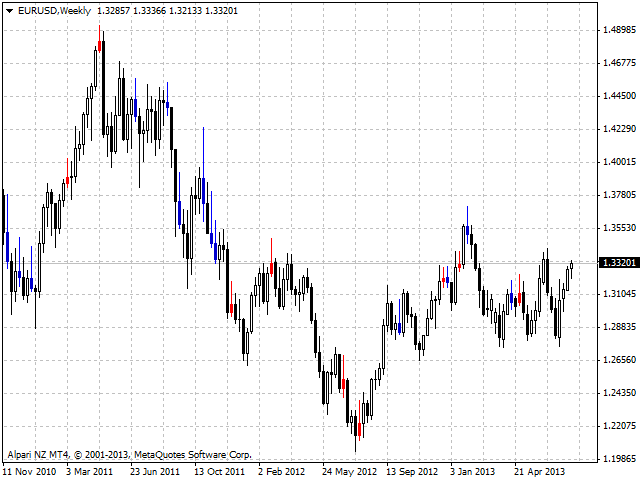
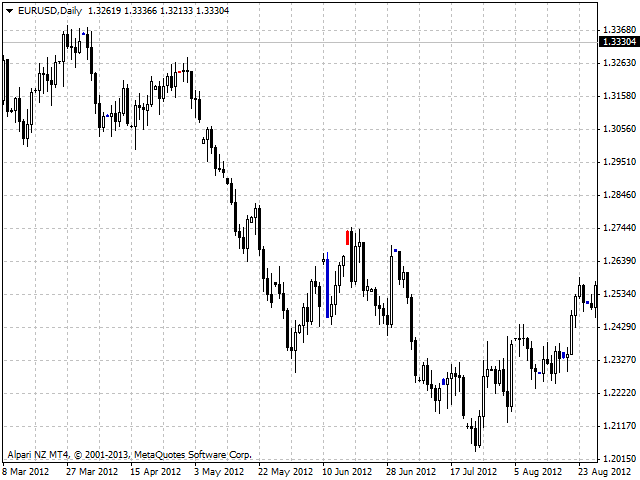
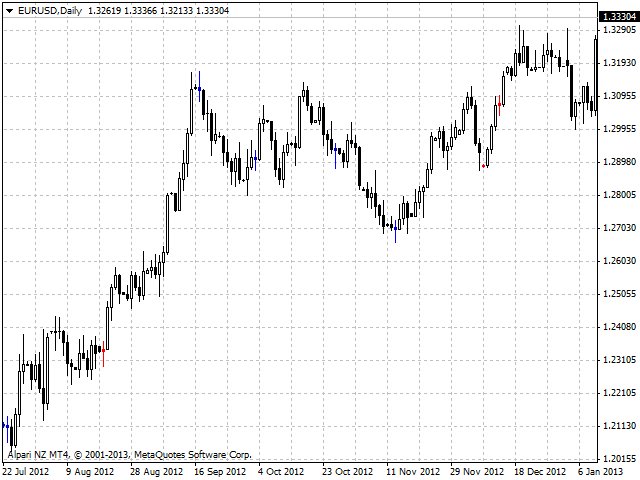
El indicador detecta los siguientes tipos de velas japonesas: Doji, Martillo y/o Hombre Colgante, Estrella fugaz y/o Martillo invertido, Peonza, Maribozu.
El indicador está destinado a la negociación manual y/o automatizada dentro de un Asesor Experto.
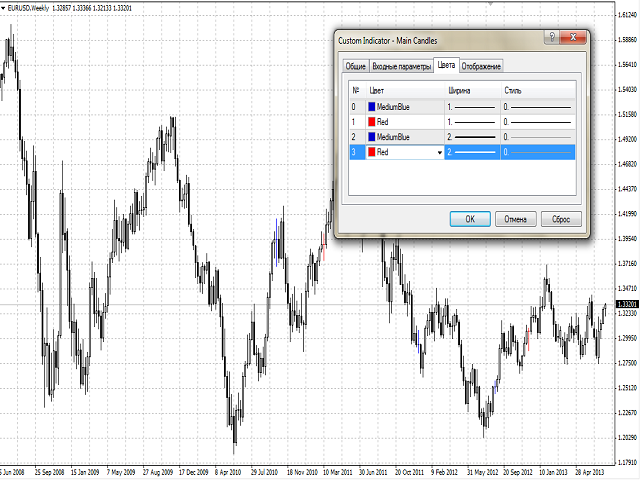
Existe la posibilidad de elegir colores para las velas alcistas y bajistas.
Para el comercio automatizado, utilice cualquier tampón indicador del tipo doble: 0, 1, 2 o 3, cuyo valor no sea cero.