Tools Smart
- Indicadores
- Versión: 1.24
- Actualizado: 23 julio 2024
- Activaciones: 7

Descripción
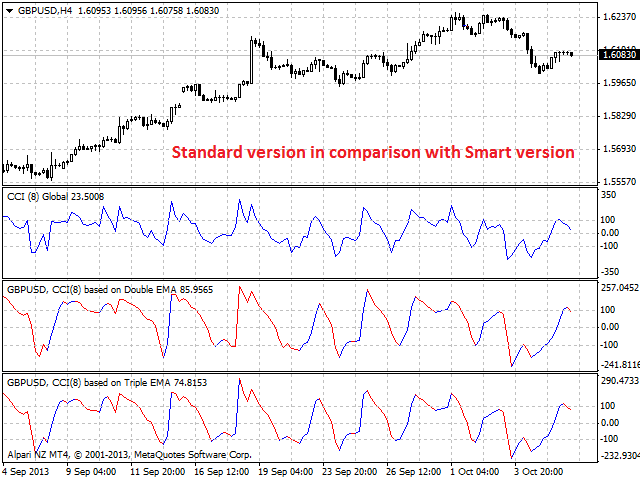
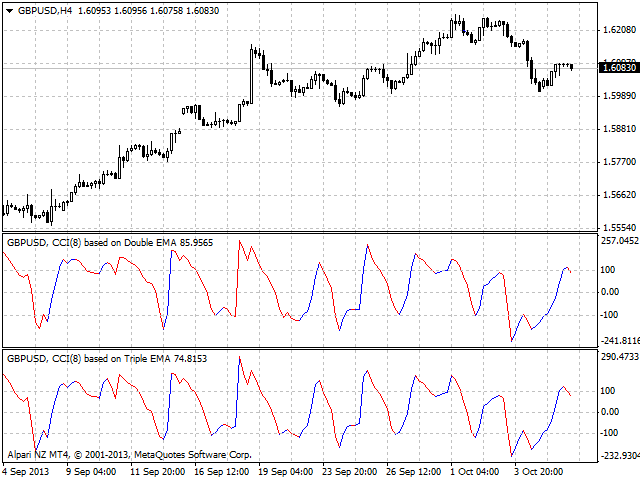
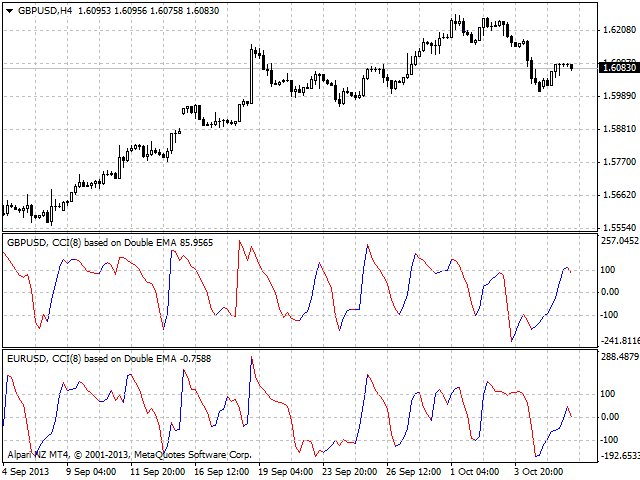
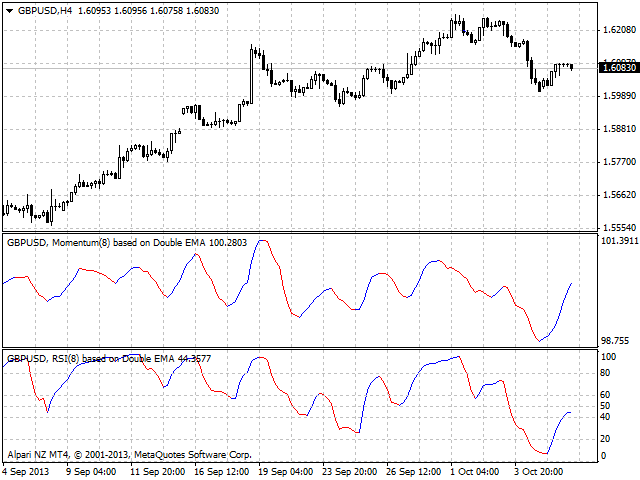
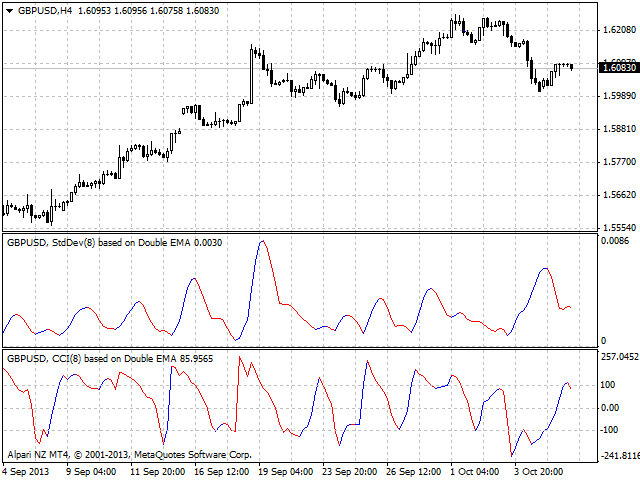
Un paquete multidivisa/multisímbolo en color de cuatro indicadores (CCI, Momentum, RSI y StdDev) basados en la doble o triple MA.
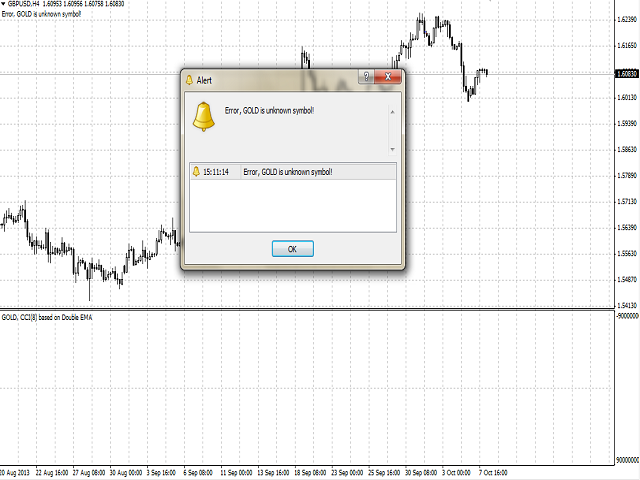
El paquete de cuatro indicadores puede utilizarse con cualquier broker, independientemente del nombre del instrumento financiero, ya que es necesario introducir manualmente el nombre como parámetro de entrada. Si introduce un nombre inexistente o incorrecto de un instrumento financiero, recibirá un mensaje de error que indica que este instrumento financiero es desconocido (no existe).
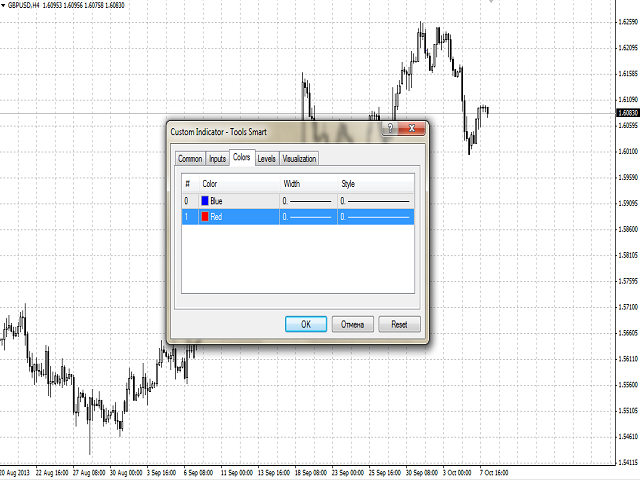
Las líneas ascendentes y descendentes del indicador pueden colorearse.
Trazado
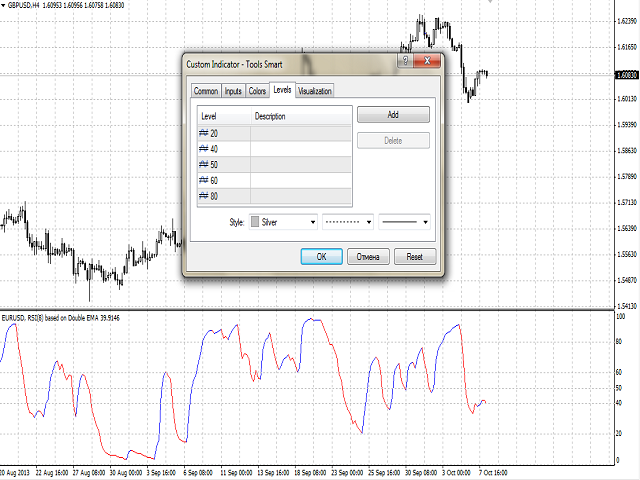
El indicador traza automáticamente líneas horizontales internas entre el máximo y el mínimo. Las líneas del máximo y del mínimo deben fijarse manualmente. Por ejemplo, para RSI - 0 y 100, para StdDev - 0.
Cuando cambie, es decir, recalcule los indicadores, las líneas de máximo y mínimo del indicador anterior deben desactivarse, las líneas internas deben eliminarse.
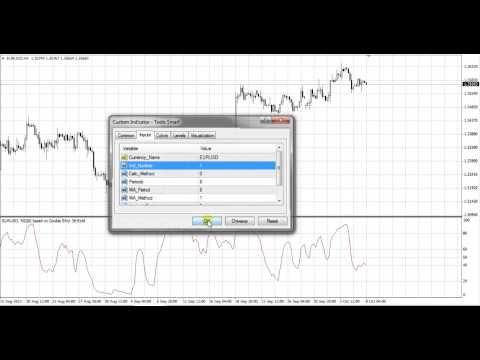
El procedimiento simple se muestra en el video. Para simplificar el procedimiento, quite el indicador anterior de la ventana y coloque el nuevo.
Propósito
Cualquier indicador calculado se puede utilizar para el comercio manual o automatizado en un Asesor Experto. Los valores de la memoria intermedia del indicador de tipo doble se pueden utilizar para el comercio automatizado:
- La línea principal del indicador - buffer 2.
- La línea ascendente del indicador - buffer 0.
- La línea descendente del indicador - buffer 1.
Entradas
- Currency_Name - el nombre del instrumento financiero.
- Ind_Number - el número del indicador calculado.
- CCI (por defecto).
- Momentum.
- RSI.
- StdDev.
- Calc_Method - método de cálculo del indicador:
- basado en la media móvil doble (por defecto).
- basado en la media móvil triple.
- Periods - período de cálculo de los indicadores.
- MA_Period - período de cálculo de la MA, en base al cual se calcularán los indicadores.
- MA_Method - método de cálculo de la media móvil.
- Applied_Price - precio utilizado.
- Shift - el desplazamiento del indicador básico con respecto al gráfico de precios.