Pulser
- Indicadores
- Versión: 2.8
- Actualizado: 30 mayo 2020
- Activaciones: 10

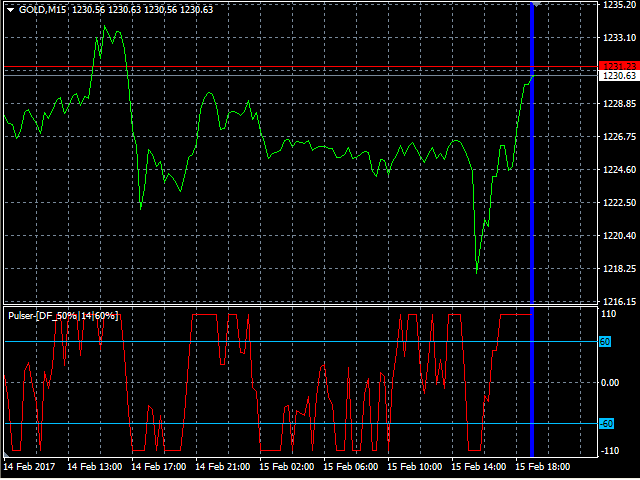
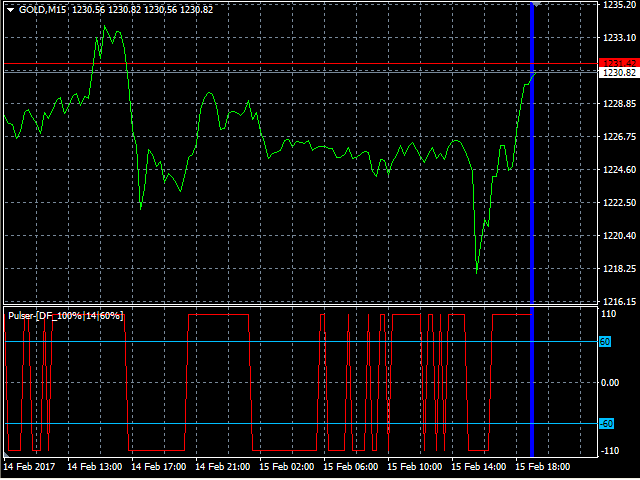
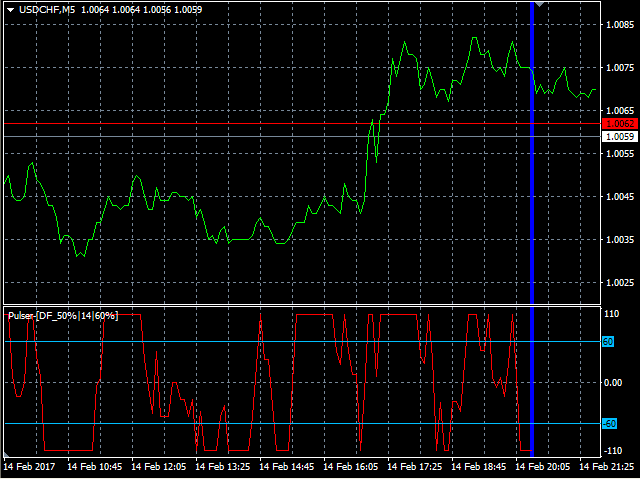
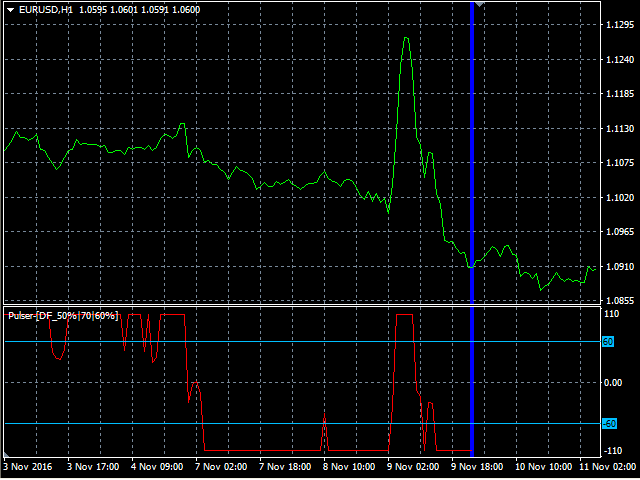
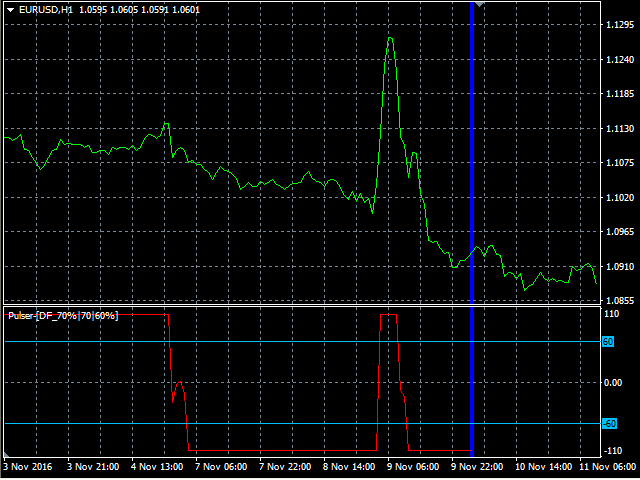
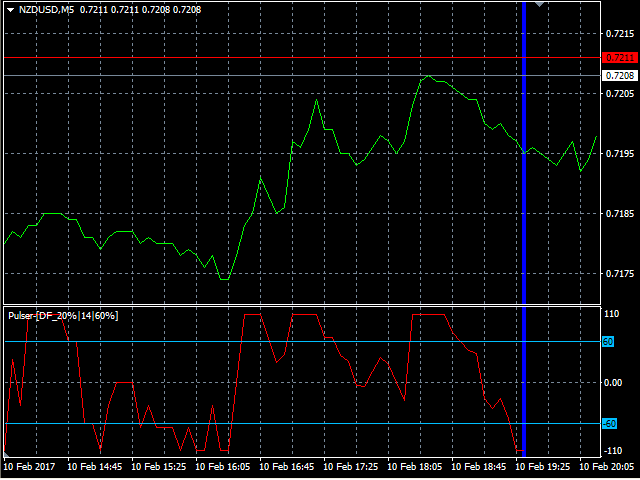
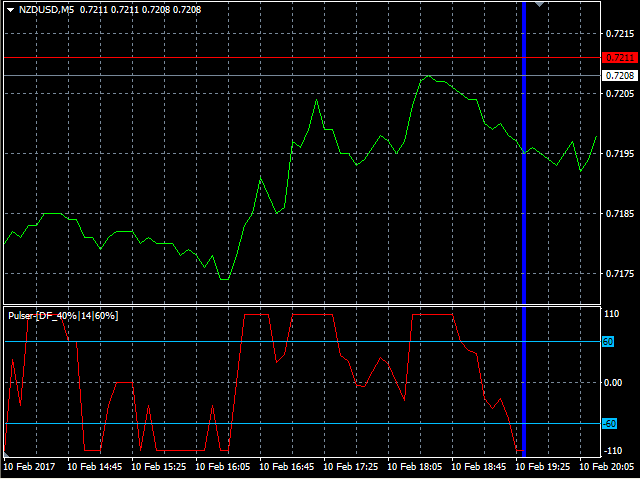
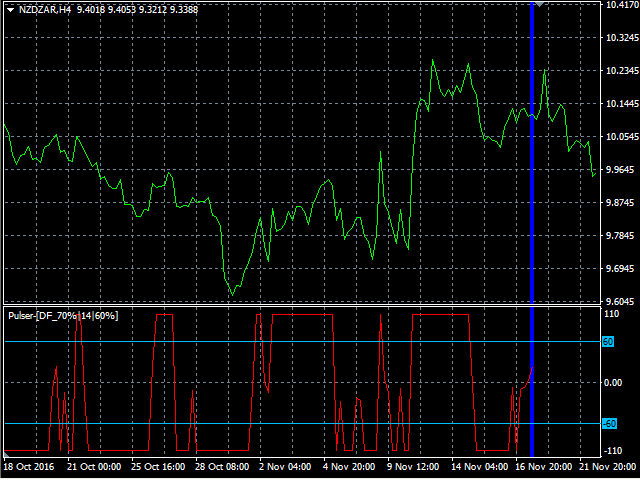
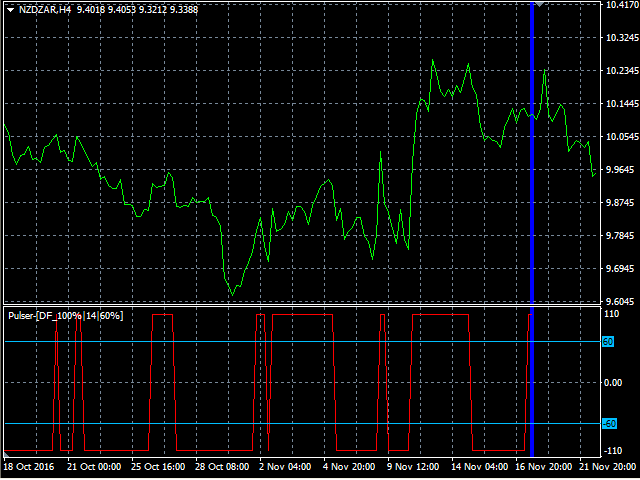
Oscilador profesional OB/OS
Es el indicador digital de momento, basado en nuestra fórmula ob/os y algoritmo de señal de salida digital.
Le muestra cuando el precio entra en posición de Sobrecompra/Venta y también de Sobrecompra/Venta de Tendencia.
En el centro hay un"Stop_level" ajustable. Por encima y por debajo de esta zona no debe operar.
Preciso; por encima de Stop_level - deje de ir largo, por debajo de Stop_level - deje de ir corto.
Los valores Min/Max del indicador son +-100%, pero la escala es +-110% solo para "mirar facilmente".
Este indicador es muy útil en la búsqueda de criterios ampliados OB/OS y también logró buenos resultados en las estrategias de negociación "Movimientos fuertes de precios".
Puede ejecutar muchas instancias, para todos los marcos de tiempo a la vez, es rápido y tiene, como todos nuestros indicadores, una tecnología incorporada de"prueba de historial de deslizamiento" y"Control de errores".
El programa está diseñado para operar en 2 modos automáticos:
1. Modo deslizante
Se activa al conectar el indicador al Chart o Visual Tester.2. Modo experto
Aquí puede probar/ajustar sus parámetros en el historial con el "deslizador" hasta 32767 barras.
Por lo tanto, mientras que Visual Testing EA, puede adjuntar el indicador y ajustar fácilmente los parámetros de entrada para los puntos críticos.
En Tester (sólo) se puede salir del "modo Slider" pulsando la tecla <Esc>.
Puede cambiar fácilmente entre marcos de tiempo en la posición seleccionada y comparar los resultados.
Se activa al iniciar el indicador con la función "iCustom".
Está diseñado sólo para uso EA y la "prueba del historial del deslizador" está desactivada.
Está probado y funciona muy bien en nuestro EA "PointerX".
Por favor, vea "pruebas" en HD . .. https://youtu.be/pBQFQ62zjis
Recomendamos ejecutar 1-2 instancias del indicador en diferentes marcos de tiempo simultáneamente para obtener mejores resultados (M15, H1) y criterios de optimización cada dos meses.
Configuración de los parámetros de entrada del pulsador
El orden de izquierda a derecha es: nombre, [valor por defecto], valor min-max.Si introduce accidentalmente un valor inferior o superior, se utilizará el valor mín-máx.
- Filtro_digital% [NONE] - filtro digital en %.
- Paso [14] 1-250 - paso del indicador en compases
- Stop_level% [60] 0-90 - nivel de parada ajustable en %.
- LastBar [0] 0-6000 - última barra para dibujar (orden descendente izquierda-derecha, 0 es la última (uso "modo experto")
- PastBars [200] 100-6000 - barras dibujadas hacia el pasado (a la izquierda)
Para programadores
Puede incluir en EA-s:
enum d_filter
{
   NONE     =0,   /*NINGUNO*/
   DF_10    =10,  /*10%*/
   DF_20    =20,  /*20%*/
   DF_30    =30,  /*30%*/
   DF_40    =40,  /*40%*/
   DF_50    =50,  /*50%*/
   DF_60    =60,  /*60%*/
   DF_70    =70,  /*70%*/
   DF_80    =80,  /*80%*/
   DF_90    =90,  /*90%*/
   DF_100   =100, /*100%*/
};
El comando conocido para recuperar el valor actual es para MQL4:
TF_ = enum_timeframes
"Pulser" = ruta/nombre del programa compilado del indicador personalizado
DFilter _ = digital_filter (enum d_filter)
pu_step_ = periodo de paso en barras (int)
pu_level _ = nivel_de_parada (int)
0 = último compás (int)
PB_ = barras pasadas (int)
0 = índice de línea
0 = desplazamiento
Información adicional
La versión demo está construida para demostrar las principales características y usabilidad de Pulser, PulserDemo.
Si desea utilizar Pulser de forma ilimitada o dentro de un EA tiene que comprar o alquilar este producto.
¿Estás satisfecho con nuestro trabajo? Comparte tus experiencias y deja un comentario.
Si necesitas ayuda para utilizar nuestras herramientas de trading o tienes algún problema o pregunta, por favor contacta conmigo.
VLabs