Tools Smart
- Indikatoren
- Version: 1.24
- Aktualisiert: 23 Juli 2024
- Aktivierungen: 7

Beschreibung
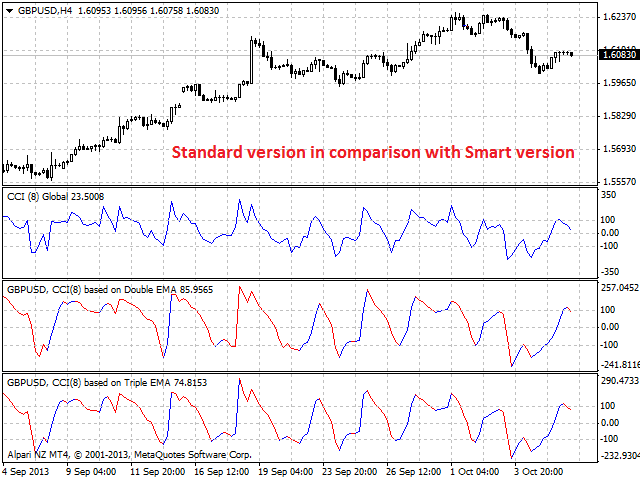
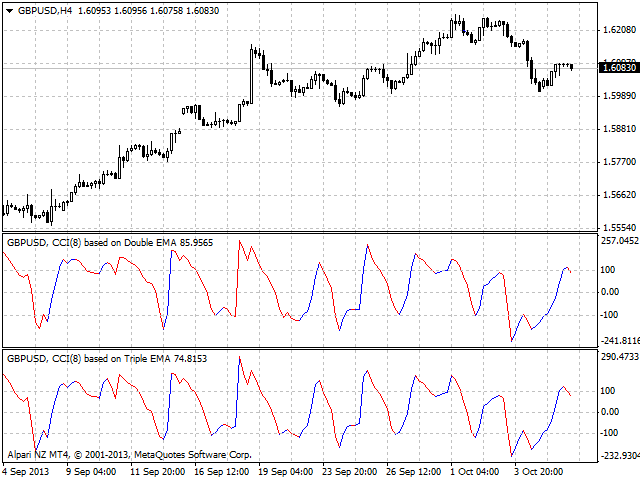
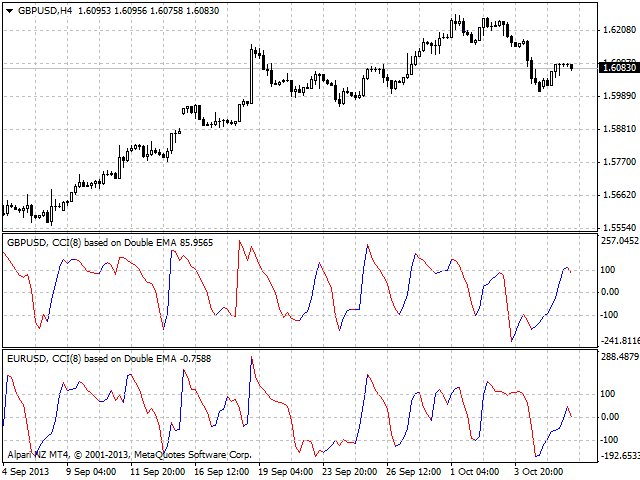
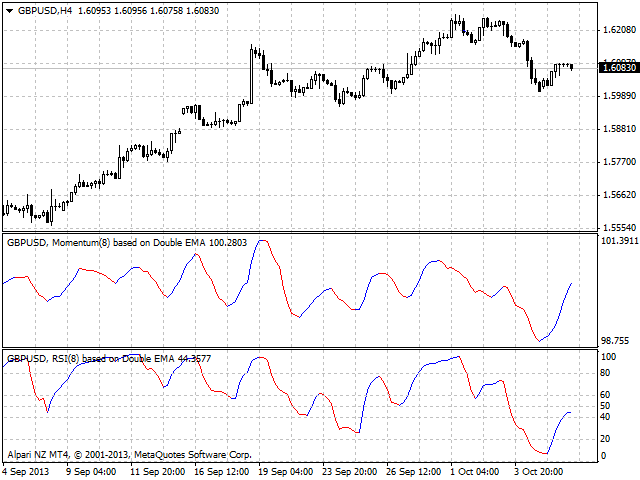
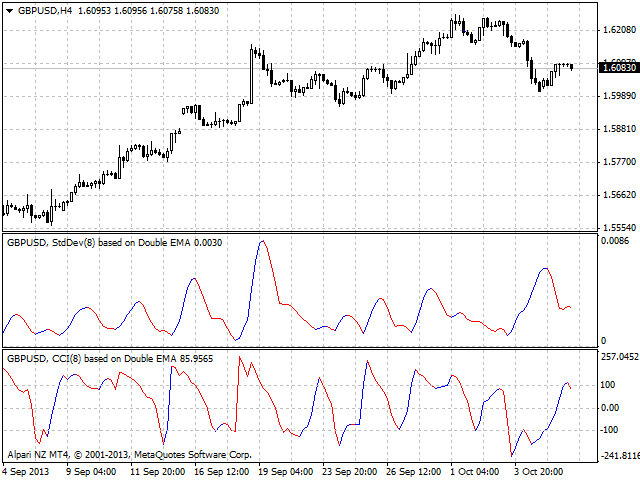
Ein farbiges Multi-Währungs-/Multi-Symbol-Paket mit vier Indikatoren (CCI, Momentum, RSI und StdDev), die auf dem doppelten oder dreifachen MA basieren.
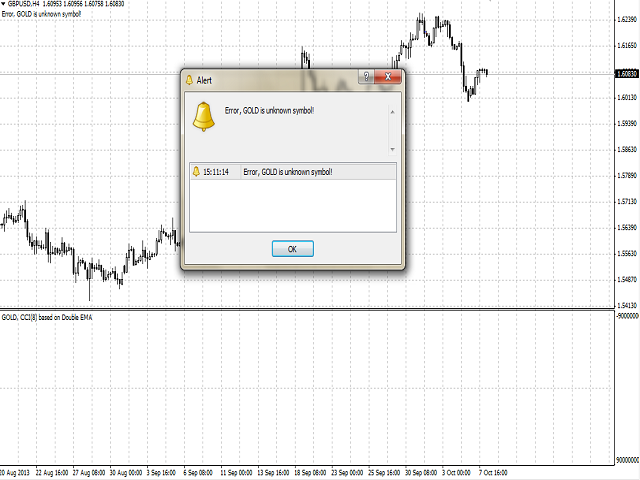
Die vier Indikatoren können mit jedem Broker verwendet werden, unabhängig vom Namen des Finanzinstruments, da der Name manuell als Eingabeparameter eingegeben werden muss. Wenn Sie einen nicht existierenden oder falschen Namen eines Finanzinstruments eingeben, erhalten Sie eine Fehlermeldung, dass dieses Finanzinstrument unbekannt ist (nicht existiert).
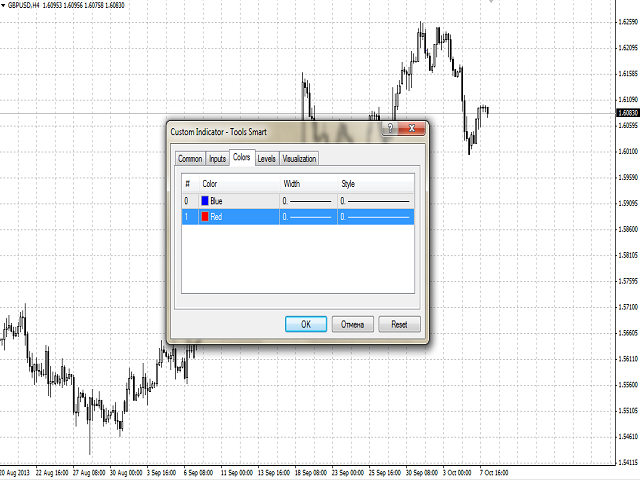
Die steigenden und fallenden Linien des Indikators können eingefärbt werden.
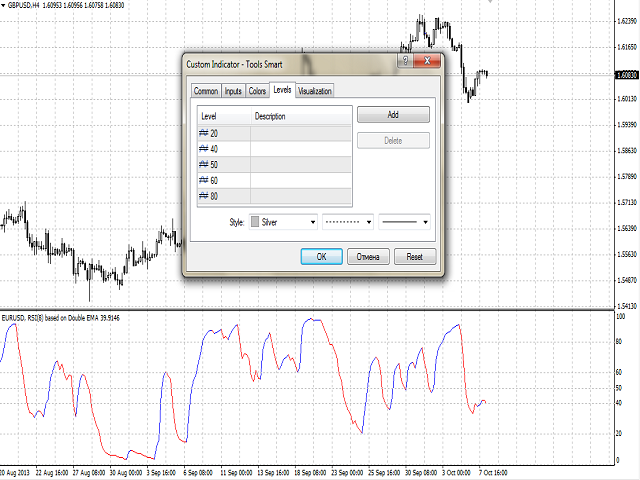
Plotten
Der Indikator zeichnet automatisch interne horizontale Linien zwischen dem Maximum und dem Minimum. Die Linien des Maximums und Minimums müssen manuell gesetzt werden. Zum Beispiel, für RSI - 0 und 100, für StdDev - 0.
Wenn Sie die Indikatoren ändern, d.h. neu berechnen, sollten die Maximal- und Minimallinien des vorherigen Indikators deaktiviert werden, die internen Linien sollten gelöscht werden.
Die einfache Vorgehensweise wird im Video gezeigt. Um das Verfahren zu vereinfachen, entfernen Sie den vorherigen Indikator aus dem Fenster und fügen Sie den neuen ein.
Zweck
Jeder berechnete Indikator kann für den manuellen oder automatischen Handel in einem Expert Advisor verwendet werden. Die Werte des Indikatorpuffers vom Typ Double können für den automatisierten Handel verwendet werden:
- Die Hauptlinie des Indikators - Puffer 2.
- Die steigende Linie des Indikators - Puffer 0.
- Die fallende Linie des Indikators - Puffer 1.
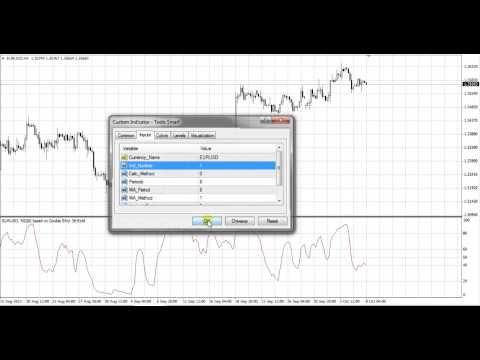
Eingänge
- Currency_Name - der Name des Finanzinstruments.
- Ind_Number - die Nummer des berechneten Indikators.
- CCI (Voreinstellung).
- Momentum.
- RSI.
- StdDev.
- Calc_Method - Berechnungsmethode des Indikators:
- basierend auf dem doppelten gleitenden Durchschnitt (Standard).
- basierend auf dem dreifachen gleitenden Durchschnitt.
- Perioden - Berechnungszeitraum der Indikatoren
- MA_Period - der Berechnungszeitraum des MA, auf dessen Grundlage die Indikatoren berechnet werden.
- MA_Methode - die MA-Mittelungsmethode.
- Angewandter_Preis - verwendeter Preis.
- Verschiebung - die Verschiebung des Basisindikators relativ zum Preisdiagramm.