Show Trade History
- Indicadores
- Versión: 1.1
- Actualizado: 26 octubre 2020
- Activaciones: 5

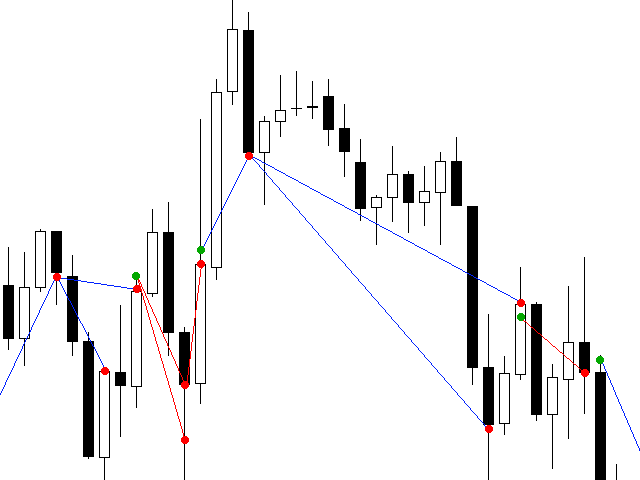
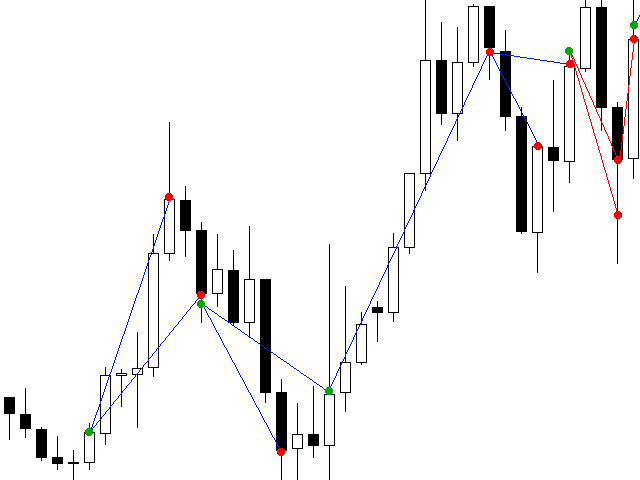
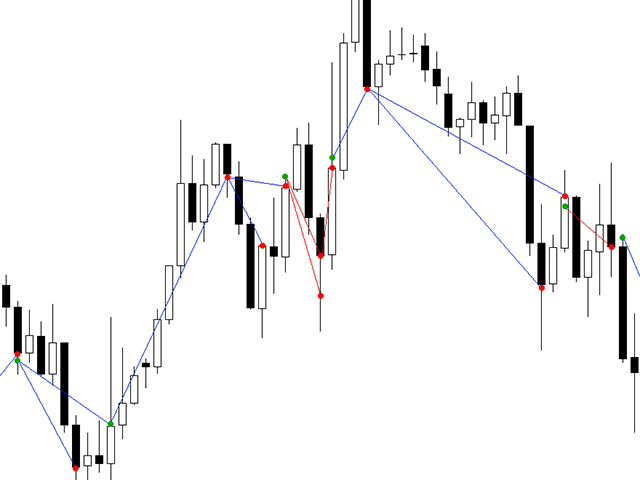
Se trata de una realización del gráfico basado en el historial de la operación. El indicador es muy intuitivo, le muestra todas las operaciones, revisión y resumen de sus problemas de comercio, lo que permite optimizar y mejorar las ideas de comercio con el fin de evitar errores similares, para mejorar continuamente su nivel de comercio haciendo su comercio más claro. Este indicador puede ser muy flexible a través de parámetros de personalización, por lo que puede ajustar de acuerdo a sus propias preferencias, personalizar el color de los puntos de entrada y salida de comercio, el color de la línea de ganancias y pérdidas, el grosor y el tamaño de los puntos y líneas, personalizar los símbolos. El color de apertura por defecto es verde, el color de cierre es rojo, las órdenes de ganancia se muestran como una línea azul, las órdenes de pérdida se muestran como una línea roja. La pantalla por defecto es el historial de transacciones de este mes, si desea mostrar más, puede personalizar la pantalla, este indicador es adecuado para todos los marcos de tiempo, si no desea mostrar el historial de transacciones, puede eliminar la lista de indicadores de índice.
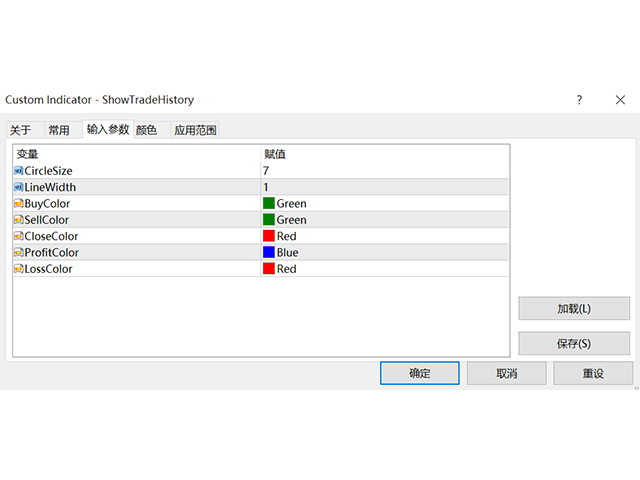
Parámetros del indicador:
- CircleSize: punto de negociación del tamaño del círculo, el valor predeterminado es 7.
- LineWidth: ancho de la línea de transacción, por defecto es 1.
- BuyColor: puntos de un solo color, por defecto es verde.
- SellColor: abrir el color de un solo punto redondo, por defecto es verde.
- CloseColor: abre los puntos de color, por defecto es rojo.
- ProfitColor: beneficio para el color de la orden, el valor predeterminado es azul.
- LossColor: el color de la orden de pérdida, el valor predeterminado es rojo.