K Channel
- Indicadores
- Versión: 1.2
- Actualizado: 25 marzo 2022
- Activaciones: 5

K_Channel es un indicador técnico que define el estado actual del mercado Forex - tendencia o plano.
El indicador funciona en cualquier marco temporal. Sin embargo, se recomiendan los marcos temporales H1 y superiores para minimizar las señales falsas.
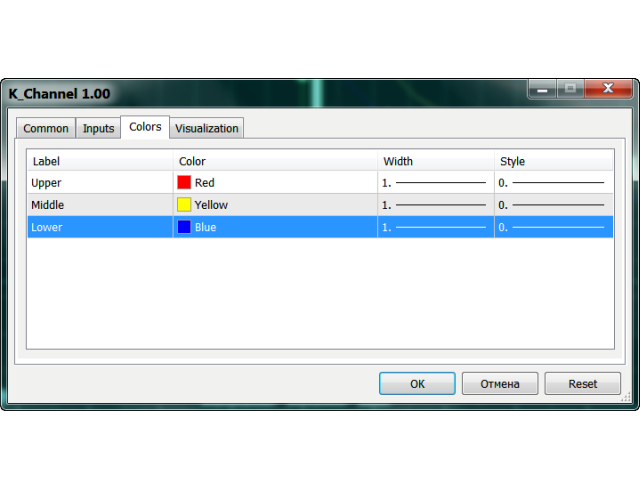
El indicador se muestra como líneas por encima y por debajo de la EMA. El Average True Range (ATR) se utiliza como anchura de las bandas.
Por lo tanto, el canal se basa en la volatilidad. Esta versión permite cambiar todos los parámetros de la Media Móvil principal.
A diferencia de Bollinger Bands que aplica el valor de la desviación estándar, К_Channel utiliza los precios máximos y mínimos dentro de un período.
El indicador K_Channel se calcula mediante la siguiente fórmula:
Nivel Superior = EMA13 (Precio Típico) + EMA13 (Rango de Negociación)
Nivel Inferior = EMA13 (Precio Típico) - EMA13 (Rango de Negociación),
Rango de Negociación = max( high(t), low(t))- min( high(t), low(t)), donde
high(t) - precio más alto del periodo actual,
low(t) - precio más bajo del periodo actual.
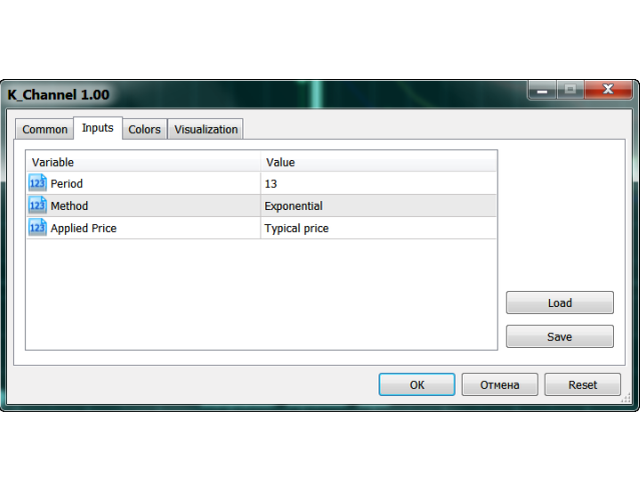
Parámetros
- período - número de barras utilizadas para los cálculos del indicador;
- método - seleccione entre los cuatro promedios móviles;
- aplicar a - seleccione entre los siete tipos de precios aplicados.


El usuario no ha dejado ningún comentario para su valoración