Institutional Swing Profile
- Indicators
- Version: 1.0
- Activations: 15

Overview
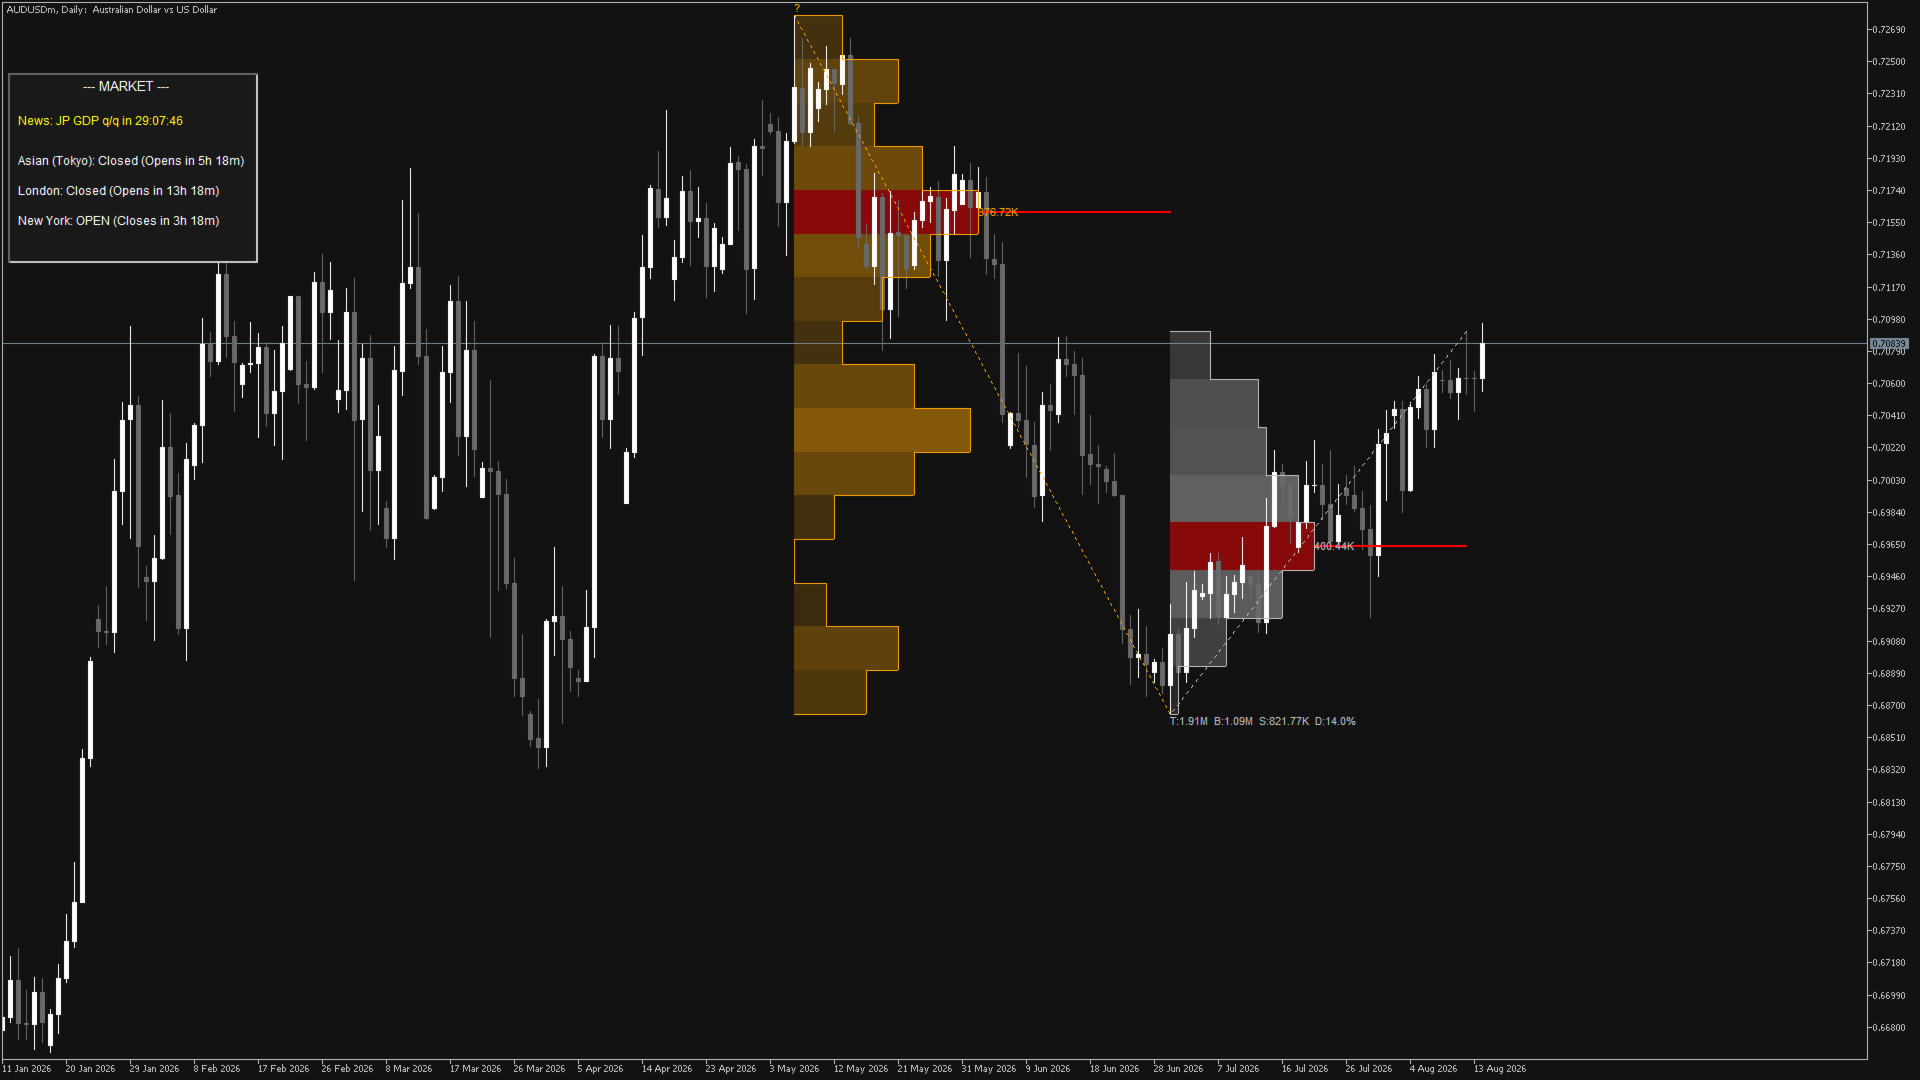
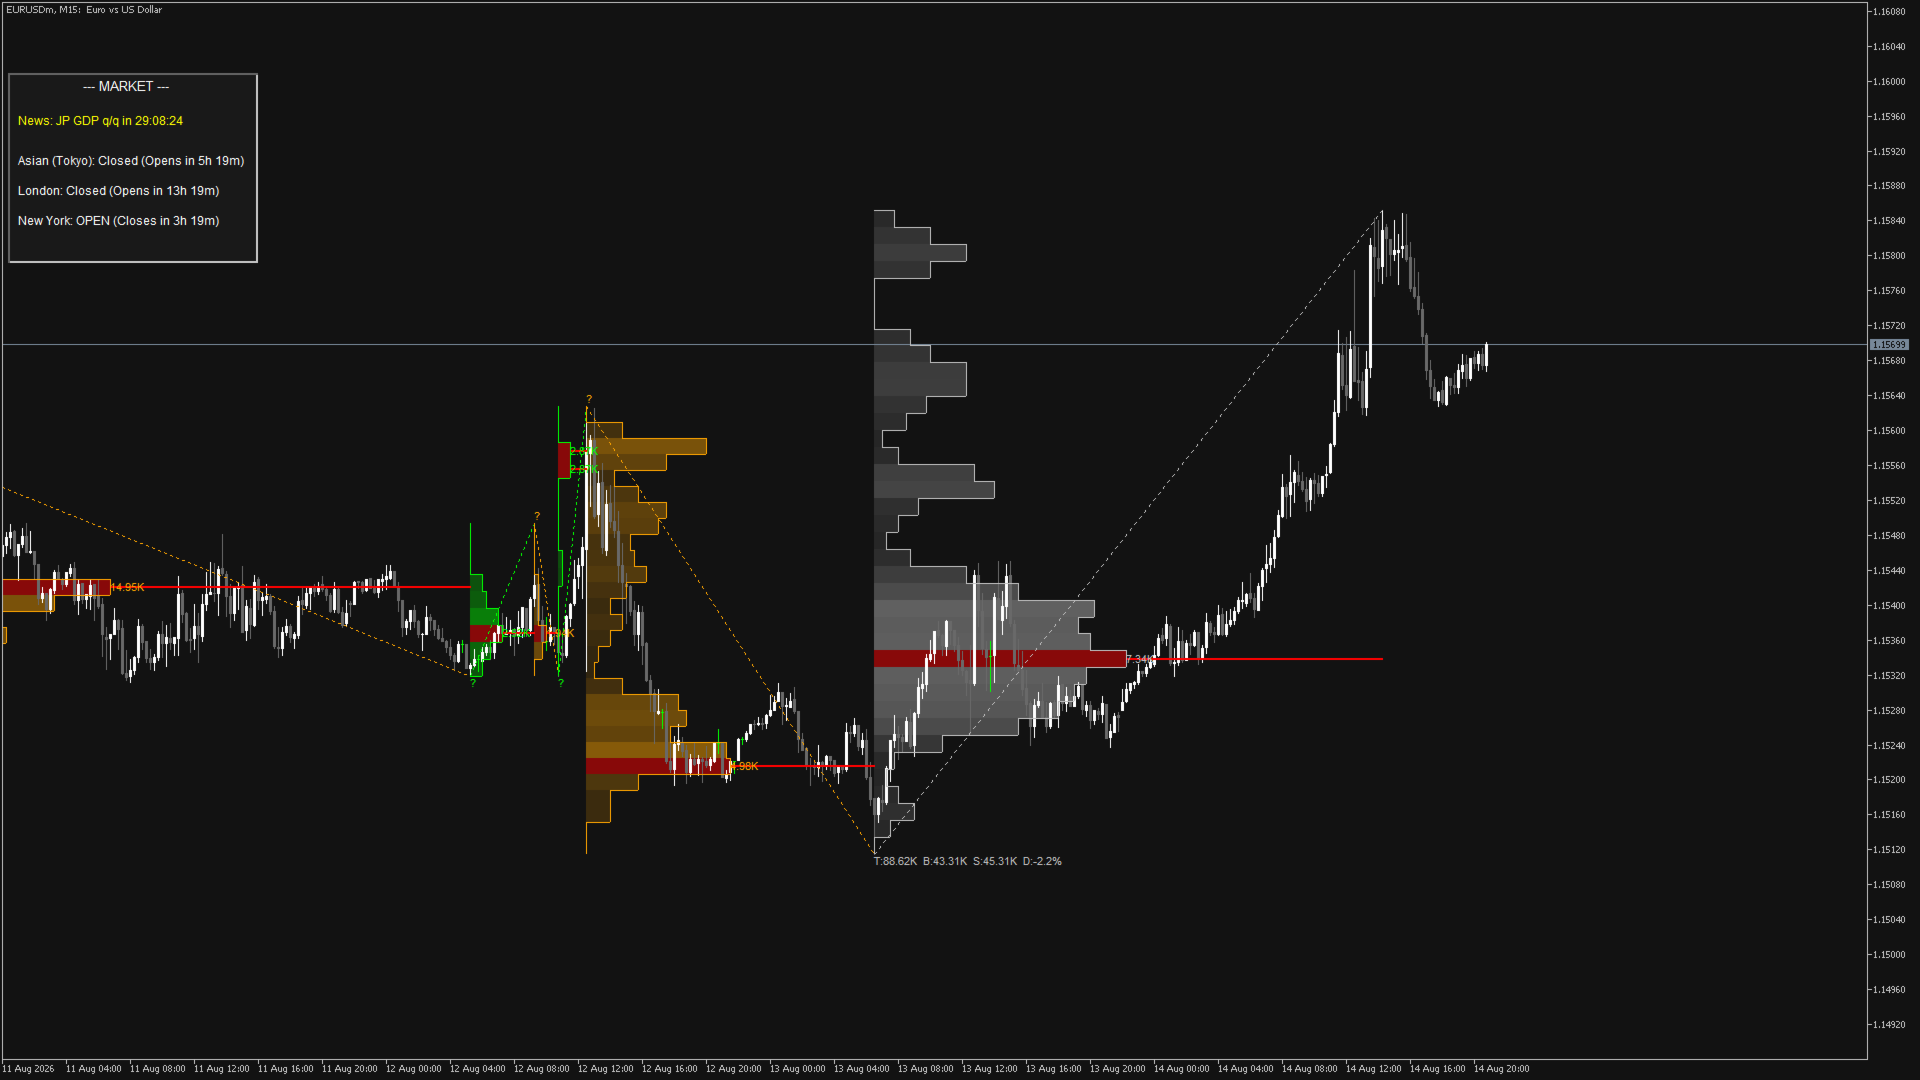
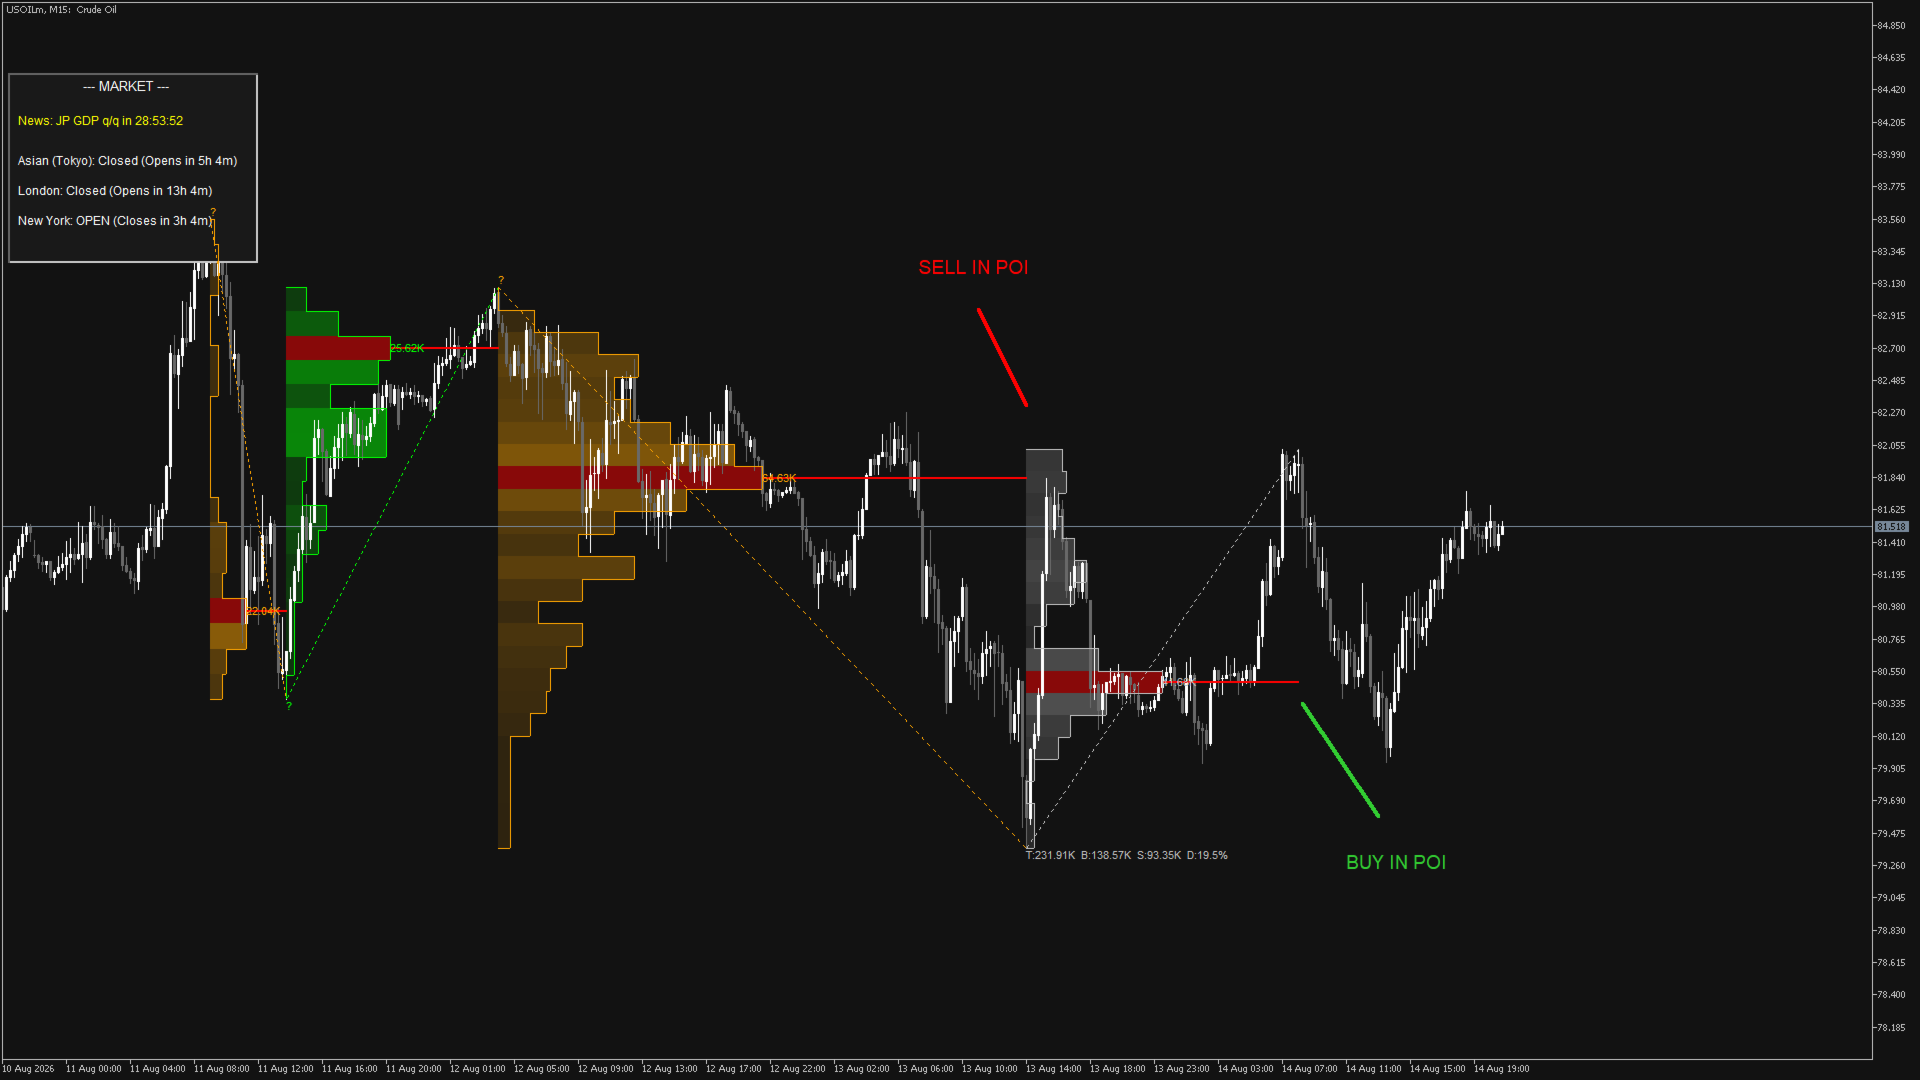
Institutional Swing Profile is a cutting-edge technical analysis tool designed for MetaTrader 5, bringing institutional-grade Volume Profile analysis directly to individual swing structures. Instead of calculating profiles over arbitrary fixed time sessions (like daily or weekly sessions), this indicator dynamically maps volume distribution across market swings, giving you crystal-clear visibility of where true institutional liquidity, support, resistance, and acceptance lie.
Whether you are a day trader looking for intraday value areas or a swing trader tracking major market shifts, Institutional Swing Profile automates the heavy lifting while keeping your charts clutter-free and visually pristine.
Key Features
-
Dynamic Swing-Based Profiles: Automatically calculates volume profiles between swing high and swing low pivot points, adapting to changing market phases organically.
-
Point of Control (POC): Instantly pinpoints the exact price level with the highest traded volume during a swing move, highlighted with custom width and color customization.
-
Buy/Sell Volume Breakdown & Delta: Measures the internal buying and selling pressure within each swing profile, displaying net delta percentages to gauge momentum shifts.
-
Built-in Market Dashboard: Features an integrated real-time HUD showing upcoming high-impact economic news timers and major global trading session countdowns (Tokyo, London, New York).
-
Multiple Visualization Modes: Choose between full profile distribution displays or heatmaps depending on your preferred charting style.
-
Smooth Moving Average Integration: Includes optional trend filtering with support for SMA, EMA, SMMA (RMA), WMA, and VWMA calculations.
-
Zero-Lag Object Reusing Engine: Meticulously optimized to handle large amounts of historical tick data without freezing your terminal or causing interface lag.
Input Parameters
| Parameter Group | Input Name | Default Value | Description |
| Swing Settings | swingLen | 50 | Lookback period used for detecting structural swing highs and lows. |
| swingColorUp | clrLime | Color styling for bullish swing formations. | |
| swingColorDown | clrOrange | Color styling for bearish swing formations. | |
| Display Options | showProfile | true | Toggles the visibility of the volume profile histogram boxes. |
| showHeatMap | false | Switches profile rendering to a volume-intensity heatmap mode. | |
| showZigZag | true | Enables or disables the structural swing connector lines. | |
| zigZagStyleInput | "Dotted" | Line style for the internal zigzag ( Dotted , Dashed , Solid ). | |
| POC Settings | showPOC | true | Highlights the Point of Control (highest volume tier) per swing. |
| pocWidthInput | 2 | Line thickness for Point of Control levels. | |
| pocColor | clrRed | Accent color highlighting the POC level. | |
| Performance | DaysHistory | 3 | Limits historical profile rendering depth to optimize performance. |
| Moving Average | maTypeInput | "None" | Applied smoothing filter ( None , SMA , EMA , SMMA (RMA) , WMA , VWMA ). |
| maLengthInput | 25 | Period length for the selected moving average filter. | |
| src | PRICE_CLOSE | Price type applied to the moving average calculation. |
Recommendations for Traders
-
Timeframes: Works exceptionally well on intraday charts (M15, H1) for day trading, as well as higher timeframes (H4, Daily) for swing positioning.
-
Asset Classes: Highly effective across Forex pairs, Gold (XAUUSD), Indices, and Cryptocurrencies that provide reliable tick volume data.
-
Chart Aesthetics: The indicator automatically applies a clean dark mode color theme upon initialization ( #121212 background) to ensure high-contrast visibility for all graphic elements.
No magic. No guaranteed signals. Just raw market clarity.
This tool is built for traders who want objective data, not empty promises. It doesn't tell you when to buy or sell, and it won't predict the future.
Instead, it gives you a clean, reliable way to view real market data so you can sharpen your own chart-reading skills and make your own trading decisions.