Watch the Market tutorial videos on YouTube
How to buy а trading robot or an indicator
Run your EA on
virtual hosting
virtual hosting
Test аn indicator/trading robot before buying
Want to earn in the Market?
How to present a product for a sell-through
New Technical Indicators for MetaTrader 4 - 5

IMPORTANT NOTE : This is a dashboard indicator and will not work on strategy tester.
Multi-Symbol Trend Scanner - Professional Market Analysis Tool Overview The Multi-Symbol Trend Scanner is a sophisticated trading dashboard that provides real-time market analysis across multiple financial instruments simultaneously. Designed for both novice and professional traders, this powerful indicator displays crucial market data in an intuitive, table-aligned format that's easy to interpret at a glan

TR-LMP Pro — Smart Auto-Mapped Liquidity Zones
TR-LMP Pro is an institutional-grade liquidity mapping indicator that automatically detects high-value liquidity levels above and below price, highlights buy-side and sell-side liquidity zones, and visualizes liquidity intensity using a clean, professional, non-retail display. Instead of manually guessing key levels, TR-LMP Pro reveals where price is most likely to target, sweep, reverse, or continue — giving traders a smarter and more objective w

Parabolic MA Pro - Système de Trading Avancé Détectez les retournements de tendance avec précision grâce à notre système unique combinant SAR Parabolique et Moyenne Mobile ! CARACTÉRISTIQUES RÉELLES SYSTÈME HYBRIDE INNOVANT SAR Parabolique calculé sur la Moyenne Mobile (au lieu du prix direct) Filtrage des faux signaux grâce à la double validation Algorithme exclusif de retournement de tendance ALERTES PRÉCISES Notifications sonores aux points de retournement Détection automati
FREE
Smoothed Heiken Ashi with AC/AO Zones – Professional Trading Clarity Transform your Heiken Ashi analysis with intelligent smoothing that eliminates noise while preserving actionable signals. What Makes This Different? This isn't just another Heiken Ashi indicator. We've engineered a sophisticated smoothing engine that works with the Accelerator (AC) and Awesome Oscillator (AO) zone logic to give you cleaner entries and exits without sacrificing responsiveness. Four Smoothing Methods at Your Comm

Long-Term Supply Demand Indicator – Description
The Long-Term Supply Demand Indicator is a professional MT4 tool designed for traders who want to track higher-timeframe support and resistance zones on lower timeframes. It identifies supply and demand areas formed on the H4 timeframe and displays them clearly on M15, M5, and M1 charts, giving traders a precise view of key market zones across multiple timeframes.
The indicator provides alerts when a new supply or demand zone is formed, allowing
FREE

Support Resistance Pro – Indicator Description Support Resistance Pro is a powerful MT4 indicator designed for traders who rely on support–resistance–based strategies. Built for professional use, the indicator automatically identifies both newly formed and historical support and resistance levels with high accuracy. The indicator continuously scans market structure to display the most relevant zones. When a support or resistance level is broken, Support Resistance Pro instantly removes the inval

OrderBlock Retest Alert – Indicator Description OrderBlock Retest Alert is an advanced MT4 indicator that identifies historical support and resistance zones and alerts traders when these levels are retested. It enables users to act on high-probability retest opportunities as they happen. The indicator automatically displays all valid historical support and resistance levels on the chart. Any level that is broken or invalidated is instantly removed, keeping your chart clean and focused on active

Trend Flower Indicator – Non Repaint indicator
The Trend Flower Indicator is an advanced trend-detection tool designed for MetaTrader 4, offering traders a reliable and effortless way to identify market direction. Built with a non-repainting algorithm, the indicator ensures that every signal displayed on the chart is final, accurate, and never repainted. Once an arrow appears, it stays permanently on the chart, providing full transparency and confidence for back-testing and live trading.
Whene

Looking for a powerful yet lightweight swing detector that accurately identifies market structure turning points?
Want clear, reliable buy and sell signals that work across any timeframe and any instrument?
Buy Sell Arrow MT Swing is built exactly for that — precision swing detection made simple and effective. This indicator identifies Higher Highs (HH) , Higher Lows (HL) , Lower Highs (LH) , and Lower Lows (LL) with remarkable clarity. It is designed to help traders easily visualize market str

The Pips Stalker is a long short arrow type indicator, the indicator helps traders of all levels to take better decisions trading the market,the indicator never repaints and uses RSI as main signal logic, once an arrow is given it will never repaint or back paint and arrows are not delayed. FEATURES OF THE PIPS STALKER ARROW : STATS PANEL a unique info dashboard that shows overall win rate % and useful stats such as max win and lost trades in a row, as well as other usefull info. TP AND SL, BUIL

Ultimate Trader Dashboard - Trade What's Moving, With Clarity
This tool pays for itself on the first day of using it. At almost every moment of the day, a symbol is trending. All you need is awareness. Ultimate Trader Dashboard (UTD) keeps you instantly aware of what's moving and in which direction — so you can join the flow instead of fighting it. Powered by our proprietary CSM algorithm, UTD combines correlation, direction, and currency strength in one clean dashboard for aligned, high‑proba
The Reflection Angle indicator is a high-precision professional tool that delivers over 90% accuracy across all timeframes . It’s designed to detect price reversals and pinpoint ideal entry points with exceptional reliability. Key Features: Works flawlessly on all timeframes with no signal delays. Performs best during high-liquidity sessions such as London and New York . Ideal for news events and volatile market conditions . Proven signal accuracy exceeding 90% in real trading tests. Recom

Indicator Name: BreakingConfirmedLevel
Type: Professional indicator for detecting confirmed breakouts of strong price levels Description:
The BreakingConfirmedLevel indicator is an advanced tool designed to detect confirmed breakouts of strong price levels in the market. It relies on precise price action analysis and multi-layer confirmation logic before generating any signal. This ensures highly accurate entry points after a real breakout, minimizing false signals and increasing consistency in
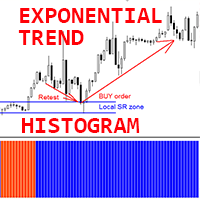
Crypto_Forex Indicator "Exponential Trend Histogram" for MT4, No Repaint.
- Exponential Trend Histogram indicator is very efficient for trend detection purpose. - The best way to use it - is to combine with Support/Resistance Levels and Retest technique (see pictures): - Once indicator detects new trend - find local SR level and arrange corresponding pending order there expecting Retest of that zone. - If new trend is bullish - arrange Buy Limit pending order; if new trend is bearish- arrange
Correlation Monitor is an indicator for quickly detecting relationships between instruments: it helps you find pairs with strong positive/negative correlation, spot divergences, and make better‑informed decisions for hedging, pair and basket trading. Meta traider 5.
Key features • Correlation matrix and compact list: instantly shows the strength of relationships between selected symbols; color coding makes it easy to read. • Mini‑chart of the correlated instrument synchronized with the visible
FREE
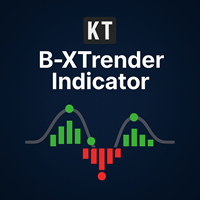
KT B-Xtrender is an advanced adaptation of the trend-following tool originally introduced by Bharat Jhunjhunwala in the IFTA journal. We’ve refined the concept to deliver more precise signals and built-in alerts, helping traders spot stronger opportunities in trending markets. While it can be applied to various charts, it shows its best performance on higher timeframes like the 4-Hour and Daily.
Features
Dual Trend View: It combines short-term and long-term analysis, making it easier to disti
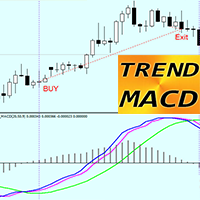
TREND MACD Indicator for MT4 - is great & efficient trading tool!
- This indicator is good for Trend Traders who are focused to catch big price movements. - TREND MACD consist of 3 lines: Green line - shows main trend direction, and Blue & Magenta lines for entry and exit. - Indicator allows to maximize profit - not to exit from profitable trade too early. - Indicator has built-in Mobile and PC alerts.
HOW TO USE indicator for Buy trades (see pictures): 1) Check if Blue & Magenta lines both a
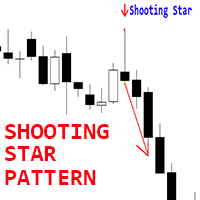
Crypto_Forex Indicator "Shooting Star pattern" for MT4, No repaint, No delay.
- Indicator "Shooting Star pattern" is very powerful indicator for Price Action trading. - Indicator detects bearish Shooting Star patterns on chart: Red arrow signal on chart (see pictures). - With PC, Mobile & Email alerts. - Indicator "Shooting Star pattern" is excellent to combine with Support/Resistance Levels.
// Great Trading Robots and Indicators are available here: https://www.mql5.com/en/users/def1380/sel
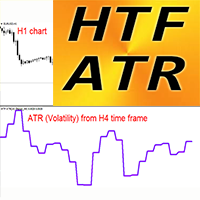
Crypto_Forex Volatility Indicator HTF ATR for MT4.
- Average True Range (ATR) itself is one of the most important indicators - it shows market volatility. - HTF ATR is a market volatility indicator used in technical analysis. HTF means - Higher Time Frame. - ATR is great to plan your dynamic Take Profits / SL locations: For example most optimal SL values are located in 1.2-2.5 ATR values. - This indicator is a useful tool to add to any trading system. - HTF ATR Indicator allows you to attach
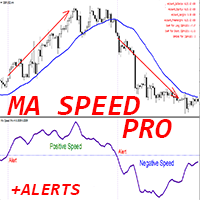
Crypto_Forex Indicator "MA Speed Pro" for MT4, No Repaint.
- SPEED of Moving Average - is unique trend indicator. - The calculation of this indicator is based on equations from physics. - Speed is the 1st derivative of Moving average. - MA Speed Pro indicator shows how fast MA itself changes its direction. - There are plenty of opportunities to upgrade even standard strategies with MA Speed Pro. Suitable for SMA, EMA, SMMA and LWMA. - It is recommended to use MA Speed Pro in trend strategies
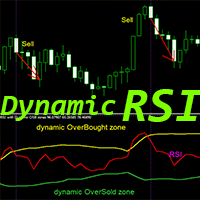
Crypto_Forex Indicator "RSI with Dynamic OverSold/OverBought zones" for MT4, No Repaint.
- RSI is one of the most popular oscillators for trading - very good for Scalping. - It is great to take Sell trades from dynamic OverBought zone and Buy trades from dynamic OverSold zone. - RSI oscillator also is very useful for divergence detection. - This indicator is excellent to combine with Price Action trades from OverSold/OverBought areas as well. - Dynamic OverBought zone - above yellow line. - Dy
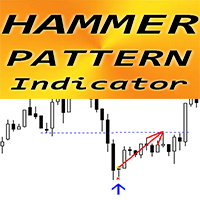
Crypto_Forex Indicator "Hammer pattern" for MT4, No repaint, No delay.
- Indicator "Hammer pattern" is very powerful indicator for Price Action trading. - Indicator detects bullish Hammer patterns on chart: Blue arrow signal on chart (see pictures). - With PC, Mobile & Email alerts. - Indicator "Hammer pattern" is excellent to combine with Support/Resistance Levels.
// Great Trading Robots and Indicators are available here: https://www.mql5.com/en/users/def1380/seller This is original prod
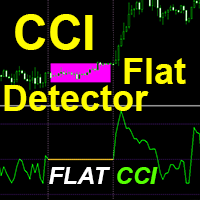
Crypto_Forex Indicator "CCI FLAT Detector" - is an efficient auxiliary tool in trading! No Repaint. I offer you to upgrade your trading methods with this great indicator for MT4.
- Indicator shows price Flat areas on the chart. It has "Flat sensitivity" parameter - which is responsible for flat detection. - "CCI FLAT Detector" can be used for Price Action entries confirmation or in combination with other indicators. - You can use it for trend following systems to detect flat zones and avoid tr
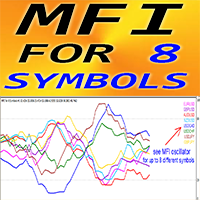
Forex Indicator "MFI for 8 Symbols" for MT4, No repaint.
- Money Flow Index (MFI) is a technical oscillator which uses price and volume data for identifying oversold and overbought zones. - It is great to take Sell entries from Overbought when the MFI is above 80 and Buy entries from Oversold when it is below 20. - MFI is very useful for divergence detection and it is great to combine with Price Action as well. - "MFI for 8 Symbols" gives opportunity to control MFI values of up to 8 different
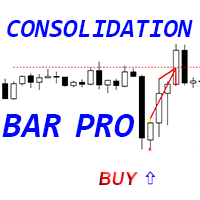
Crypto_Forex Indicator "Consolidation Bar Pro" for MT4.
- Indicator "Consolidation Bar Pro" is very powerful breakout-focused indicator for Price Action trading. - Indicator detects price consolidation in narrow area during 1 bar and shows: Breakout direction, Pending order location and SL location. - Bullish Consolidation Bar - Blue arrow signal on chart (see pictures). - Bearish Consolidation Bar - Red arrow signal on chart (see pictures). - No repaint, No delay. - High R/R ratio (reward/ris
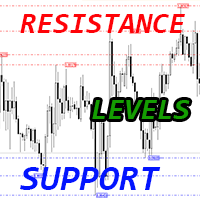
Crypto_Forex Indicator "Support Resistance Levels" for MT4.
- Indicator "Support Resistance Levels" is very useful auxiliary indicator for trading. - "Support" and "Resistance" are important zones on chart respected by price. - Support level is where the price regularly stops falling and bounces back up. - Resistance level is where the price normally stops rising and dips back down. - Indicator "Support Resistance Levels" shows the recent levels: - Resistance levels - red lines. Support level
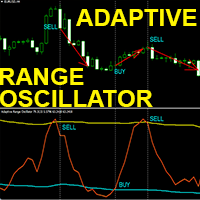
Advanced custom Crypto_Forex indicator "Adaptive Range Oscillator" - efficient Trading tool for MT4!
- This indicator is a New generation of Oscillators - see pictures to check how to use it. - "Adaptive Range Oscillator" has adjustable adaptive Oversold/Overbought zones and other useful settings. - This oscillator is a suitable tool to find exact trade entry points on the Exits from dynamic OverSold/OverBought areas. - Oversold zone: below the Blue line. - Overbought zone: above Yellow line

The Price Predictor is an indicator designed for MetaTrader 4, developed in MQL4, created to provide a deeper and smarter reading of price movements. It’s built to anticipate potential trend reversals and follow strong directional phases with a high level of accuracy. Rather than reacting passively to candles, it interprets market context by analyzing the strength and consistency of ongoing movements. Unlike traditional indicators, Price Predictor is based on an adaptive logic that takes current

Sentinel Arrow Key Features:
⊗An exclusive algorithm for quickly and accurately identifying trends, reversals, and momentum changes. ⊗Designed for professional use, it features robust signal logic that eliminates delays or false updates. ⊗Suitable for various timeframes. ⊗Does not redraw, delete, or modify past signals. ⊗All BUY and SELL signals are generated on the candlestick itself and remain fixed. ⊗In real trading, there is no redrawing—signals appear instantly on the candlestick itself.
FREE

Our indicator is designed for traders who value accuracy, reliability, and versatility in market analysis. It combines a simple interface with advanced signal generation logic, making it an indispensable tool for both beginners and experienced market participants.
I. ️ Main Advantage: Absolute Signal Reliability The indicator's main value lies in its algorithmic integrity, which eliminates the main problem with many tools—redrawing.
No Redrawing: The indicator guarantees that no past signal
FREE

Hermes Trend
Designed for professional use, it features robust signal logic and secure calculations that eliminate delays or false updates. It does not redraw, delete, or modify past signals.
All signals are generated on the candlestick itself and remain fixed.
In real trading, there is no redrawing—signals appear instantly on the candlestick itself. Provides professional-level stability, accuracy, and flexibility. The system accurately identifies trend and momentum changes, as w
Smart Volume Activity [SVA] is an advanced analytical indicator designed for MetaTrader platforms. It reveals how institutional (Smart Money) and retail traders operate by analyzing volume behavior across multiple timeframes . Unlike ordinary volume tools, SVA automatically adapts to any chart timeframe and highlights zones of absorption — moments when large market participants absorb liquidity from weaker hands. By detecting abnormal volume spikes far beyond typical mark

Sweeper PRO – Advanced Candle Sweep Detector (3-in-1) For any questions, technical issues, or support requests, feel free to contact us through any of the following channels: WhatsApp Support: Contact1 Contact2 Email:
Money.transporter@gmail.com Overview Sweeper PRO is a powerful and fully customizable indicator designed to detect three unique types of candle sweeps — smart entry and reversal patterns commonly used by professional price action traders.
It automatically identifies po

Double Edge Forex Indicator — User Manual “Master both sides of the market with precision and clarity.” ️ Introduction Welcome to the Double Edge Forex Indicator — your trading companion designed to simplify market analysis and amplify trading confidence. This tool empowers traders to visualize trend strength , direction , and reversal zones across multiple timeframes — all from one elegant chart panel. Whether you’re a scalper , swing trader , or day trader , Double Edge helps you identify
Looking for a trading tool based on the moving average indicator that can display crossovers arrows on all time frames? Introducing trading indicator : All Time Frame Two MA Model T ready to help you achieve daily profits. This tool is created using the intersection of two moving average indicator lines: the main MA1 and the signal MA2. Using this tool makes it easier to observe the real-time dashboard and intersections of multiple timeframes simultaneously. Viewing both higher and lower timef

Looking for a trading tool based on the moving average indicator that can display crossovers arrows on all time frames? Introducing trading indicator : All Time Frame Two MA Model S ready to help you achieve daily profits. This tool is created using the intersection of two moving average indicator lines: the main MA1 and the signal MA2. Using this tool makes it easier to observe the real-time dashboard and intersections of multiple timeframes simultaneously. Viewing both higher and lower timefr
Looking for a trading tool based on the CCI indicator that can display crossovers arrows on all time frames? Introducing trading indicator : All Time Frame Double CCI Model S ready to help you achieve daily profits. This tool is created using the intersection of two CCI (Double CCI) indicator lines: the main CCI and the signal CCI. Using this tool makes it easier to observe the real-time dashboard and intersections of multiple timeframes simultaneously. Viewing both higher and lower timeframes
RET System Fast Bias The RET Fast Bias indicator is number 4 of 10 tools in the RET System , revealing when short-term momentum begins to shift against or with the dominant trend.
It helps traders identify the first signs of bias change — when short-term energy confirms, opposes, or precedes the larger market move. Built around Reversal Anticipation , Fast Bias is designed to show when price action is about to change direction before it does. What It Does Displays short-term market bias di

Looking for a trading tool based on the MACD indicator that can display crossovers arrows on all time frames? Introducing trading indicator : All Time Frame MACD Model T ready to help you achieve daily profits. This tool is created using the intersection of two indicator lines of MACD : the main MACD and the signal MACD. Using this tool makes it easier to observe the real-time dashboard and intersections of multiple timeframes simultaneously. Viewing both higher and lower timeframes simultaneou
Looking for a trading tool based on the MACD indicator that can display crossovers arrows on all time frames? Introducing trading indicator : All Time Frame MACD Model S ready to help you achieve daily profits. This tool is created using the intersection of two indicator lines of MACD : the main MACD and the signal MACD. Using this tool makes it easier to observe the real-time dashboard and intersections of multiple timeframes simultaneously. Viewing both higher and lower timeframes simultaneou

Looking for a trading tool based on the Stochastic indicator that can display crossovers arrows on all time frames? Introducing trading indicator : All Time Frame Stochastic Model T ready to help you achieve daily profits. This tool is created using the intersection of two indicator lines of Stochastic : the main Stochastic and the signal Stochastic . Using this tool makes it easier to observe the real-time dashboard and intersections of multiple timeframes simultaneously. Viewing both higher

Looking for a trading tool based on the Stochastic indicator that can display crossovers arrows on all time frames? Introducing trading indicator : All Time Frame Stochastic Model S ready to help you achieve daily profits. This tool is created using the intersection of two indicator lines of Stochastic : the main Stochastic and the signal Stochastic . Using this tool makes it easier to observe the real-time dashboard and intersections of multiple timeframes simultaneously. Viewing both higher
Looking for a trading tool based on the RSI indicator that can display crossovers arrows on all time frames? Introducing trading indicator : All Time Frame Double RSI Model T ready to help you achieve daily profits. This tool is created using the intersection of two RSI (Double RSI) indicator lines: the main RSI and the signal RSI. Using this tool makes it easier to observe the real-time dashboard and intersections of multiple timeframes simultaneously. Viewing both higher and lower timeframes
Looking for a trading tool based on the RSI indicator that can display crossovers arrows on all time frames? Introducing trading indicator : All Time Frame Double RSI Model S ready to help you achieve daily profits. This tool is created using the intersection of two RSI (Double RSI) indicator lines: the main RSI and the signal RSI. Using this tool makes it easier to observe the real-time dashboard and intersections of multiple timeframes simultaneously. Viewing both higher and lower timeframes
Quick Draw Panels lets you instantly draw custom present trading objects (zones and trendlines) instantly with one click from the panel fixed neatly in any chart corner. This is the mt4 version of the product. No more searching through toolbars or menus one click, one object, done. Fully customizable colors, line size, and style.
Ideal For: Institutional / Smart Money Concept (SMC) / Supply and Demand traders. Supply and Demand zone marking. Technical Analysis marking. Liquidity and ICT Order
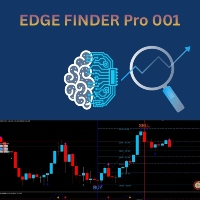
Edge Finder Pro 001 i s your all-in-one visual trading assistant, designed to cut through the market noise and highlight high-probability trading opportunities at a glance. It is an enhanced version with profit-taking levels, improved chart visibility, and greater ease in entering and exiting the market . How It Works (The Core Idea): Instead of overloading your chart with complex numbers, Edge Finder Pro 0 0 1 uses a unique, color-coded system to paint the market picture clearly. Trend & M

Toukou Indicator – Your Winning Edge for Gold and Forex Trading The Toukou Indicator is a powerful trading tool designed to maximize profits in Gold (XAUUSD) and the Forex market .
Built on advanced algorithmic logic, it accurately identifies ideal entry and exit zones , adapting dynamically to changing market conditions. ️ Key Features: Smart Trend Detection: Instantly identifies bullish and bearish market phases. Accurate Buy & Sell Signals: Generated only under the most favorable tr
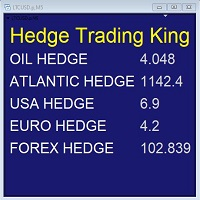
Hedge Trading Monitor e' il mio indicatore che monitora a colpo d'occhio la differenza o il ratio tra due asset utili per fare Hedge trading.
Come si utilizza + scaricare l'indicatore + applicare l'indicatore su un grafico aperto + si possono cambiare gli asset agendo nelle impostazioni.
Distribuzione + e' distribuito solo su MQL5.vom + licenza gratuita (FREE)
FREE
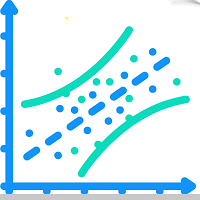
1. Indicator Purpose and Inputs Overview The Linear Regression Forecaster is an advanced analytical indicator designed to perform comprehensive trend evaluation and short-term price forecasting using the Linear Regression (LR) statistical method.
It is optimized for the Weekly (W1) timeframe and combines both long-term trend analysis and short-term rolling trend dynamics to generate reliable weekly forecasts. The indicator operates using two distinct timeframes : Long-Term Period (e.g., 52 weeks
FREE
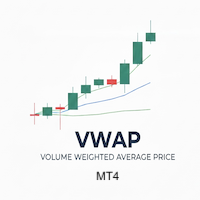
Buy 1 Get 1 Free Key Features and Advantages of VWAP 1. It Shows the "True Price" or "Consensus Price" This is its most important feature. While a Simple Moving Average (MA) gives equal weight to every price, VWAP tells us what the average price really is, based on where the majority of money (volume) agreed to trade. Example: If the price of 100 had 1,000,000 shares traded, but the price of 101 only had 100 shares traded... VWAP will give significantly more weight to the 100 price. 2. It
Trend Flow Entry Pro is a simple yet powerful trend-following indicator designed to help you enter the market at optimal pullback points.
The system displays an Entry Signal at the top-right corner of the chart.
When both indicators are blue, a Buy signal is triggered — ideal for long entries.
When both are red, it signals a Sell opportunity — perfect for short trades.
These signals appear only when the market is trending clearly, helping you ride the wave with confidence and avoid sideways

GainLossView – Smart Profit Tracker for Every Trader GainLossView is a powerful yet lightweight indicator designed to give you real-time visual control of your trading performance — directly on the chart.
Whether you trade manually or with Expert Advisors , GainLossView keeps you fully aware of your daily gains, current losses, and total balance with clean, instant updates. Why Traders Love GainLossView GainLossView turns your chart into a live performance dashboard.
It helps you stay conn

This system is very useful for trading because it solves several classic problems: 1. Objectivity & Precision Benefit: It eliminates the trader's personal bias. Every trader might draw a trendline slightly differently, but this indicator uses a precise mathematical logic (Fractals) to find the pivot points. The resulting lines are objective and consistent every time. 2. ️ Dynamic Updates Benefit: Your chart is always current. As soon as a new pivot is confirmed, the new trendline is drawn
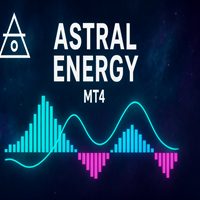
Astral Energy (MT4) From the Astral Mechanics Lab – Ptr777 Overview Astral Energy is an advanced subwindow indicator designed to visualize the directional “flow” of market energy through a harmonic dual-stream histogram.
It interprets the balance of internal strength and weakness within price movement — revealing when the market’s astral momentum is aligning for expansion (ascending phase) or contraction (descending phase). Behind the scenes, Astral Energy translates complex volatility and di

Trendline Alert Pro is a MetaTrader 4 indicator that monitors the objects that you created such as trendlines, horizontal lines, rectangles, Fibonacci levels, and instantly alerts you when price interacts with them.
MT5 version is here PM me to receive a 7-day trial version of the product.
Multi-Object Monitoring Trendlines, channels, and angled lines Horizontal & vertical lines Rectangles (support/resistance zones) Fibonacci retracements & expansions (customizable levels) Flexible Alert Opt
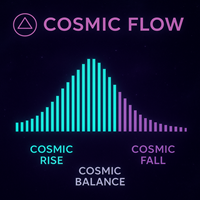
Cosmic Flow
From the Astral Mechanics Lab – Ptr777 , Cosmic Flow is the harmonic oscillator at the heart of astral motion and energetic balance. It visualizes the subtle rhythm between celestial expansion and contraction — the hidden pulse that governs the market’s energetic tides. Each bar in the histogram represents the phase alignment between astral momentum and harmonic strength, capturing the invisible ebb and surge of flow between creation (rise), dissolution (fall), and the void of b
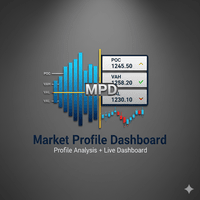
Market Profile with Dashboard Indicator - Complete User Guide
indicator Overview The Market Profile with Dashboard is a comprehensive trading analysis tool for MetaTrader 4 that displays market profile data, volume analysis, and key market structure information directly on your chart. This indicator helps traders identify significant price levels, market balance areas, and potential trading opportunities based on market profile theory.
Core Components and Features
Market Profile Display - Sh
FVG Detector Pro — Advanced Fair Value Gap Detection System FVG Detector Pro is a powerful and precise tool designed to automatically identify Fair Value Gaps (FVGs) on any symbol and timeframe.
It helps traders spot potential supply and demand imbalance zones that can signal high-probability reversal or continuation opportunities. This indicator was engineered for professional traders who rely on price action, imbalance, and institutional order flow concepts — while maintaining excellent perfor
Track your daily profit and loss in real time. Displays current account performance, peak gain, and drawdown directly on the chart. Simple, lightweight, and compatible with all symbols. Daily Trade Monitor — Real-Time Daily P&L Tracker for MetaTrader 4 Monitor your trading performance with precision. Daily Trade Monitor is a lightweight, visual indicator that displays your current account profit or loss and captures the maximum profit and loss of the day, indicating the exact time and minute eac

Goldman Balanced PRO, is an Indicator that has merges EMA trend structure, Stochastic Oscillation, RSI Momentum and ATR volatility zones into a single visual indicator. This produces clean zones and show possible areas of bulls and bears supported by confidence meter and retracement filters. this will give an overview of how the market is currently structured.

PairMaster Buy Sell Arrow Indicator for MT4 Trade Reversals Like a Pro — Catch Every Swing Point with Precision The PairMaster Buy Sell Arrow Indicator is a powerful MetaTrader 4 tool built to identify high-probability swing trading opportunities . Designed for traders who value accuracy, clarity, and simplicity, PairMaster detects key market turning points and plots intuitive buy and sell arrows directly on your chart. Key Features Accurate Swing Point Detection – Automatically identifies ma

Trade Session Marker is an advanced Session marker Designed for professional traders seeking clarity, accuracy, and smart session label. this gives clear session start and ending. that will enable user to make decision on what to do in the session. It marks all session start and close, for clarity 15M timeframe gives a clear marker. this will boost planning for entry and exit of trades, it also allow you to see how the market has moved over the session.
Signal Histogram is a reliable technical indicator for the MetaTrader 4 platform designed to visually identify the current trend by comparing the closing price with a moving average. The indicator displays the histogram in a separate window: green bars indicate that the price is above the average, while red bars indicate that the price is below or equal to the average. This approach allows you to quickly assess the trend direction and identify potential reversal points. The indicator generates
Product Title ZigZag Colored (MT4)
See also >> Smart ZigZag Pro , Smart ZigZag (free)
Short Description Dual‑color ZigZag for MT4 that solves the single‑line color limitation and provides EA‑ready buffers with current leg value and direction per bar. Overview Renders the classic ZigZag path as two color‑coded legs (up/down) for instant structure reading; per‑bar values exposed for EAs/indicators. Key Features Dual‑color legs (user colors); EA‑ready buffers ZigZag Up , ZigZag Down , ZigZag
FREE
Banks Session Lines Indicator The Banks Session Lines automatically highlight times of the day the price moves.
It helps smart money traders to clearly mark and track the key institutional trading sessions the banks operate in — Asian, London, and New York with fully customizable session lines for your charts.
Designed for traders who need clarity and precision when tracking volatility cycles.
Why Banks Session Lines? Because every major move begins and ends within institutional banks trading

VWAP for Scalpers
Session-aware VWAP lines for fast, precise scalps. ️ Inputs (MT4/MT5) Enable_Hourly_VWAP: Toggle hourly VWAP. Enable_Asia_VWAP: Toggle Asia session VWAP. Enable_Europe_VWAP: Toggle Europe session VWAP. Enable_NA_VWAP: Toggle North America session VWAP. Enable_Extended_VWAP: Toggle extended session VWAP. Enable_Daily_VWAP: Toggle daily VWAP. Asia Session (GMT) Session_Asia_Start_Hour: Asia session start time. Session_Asia_End_Hour: Asia session end time. Europe Session (GMT) S
FREE
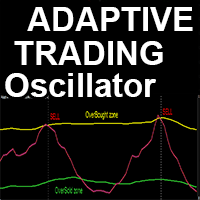
Advanced custom Crypto_Forex indicator "Adaptive Trading Oscillator" - efficient auxiliary Trading tool for MT4!
- This indicator is a New generation of Oscillators - see pictures to check how to use it. - "Adaptive Trading Oscillator" has adjustable adaptive Oversold/Overbought zones. - This oscillator is an auxiliary tool to find exact trade entry points on the Exits from dynamic OverSold/OverBought areas. - Oversold zone: below the Green line. - Overbought zone: above Yellow line . - This

Institutional Liquidity Compression Indicator This indicator measures real-time liquidity tightening using the normalized width of Bollinger Bands, trading volume, and average spread to identify compression phases preceding price breakouts. Display:
Professional-style separate window with a histogram showing the “Compression Score” and a threshold line. Key Features Early Detection: Identifies contraction zones before major price impulses. Multi-Factor Measurement: Combines normalized Bollinger

Crypto_Forex Indicator "Engulfing_Bar and Consolidation_Bar" patterns for MT4, No repaint, No delay.
- "Engulfing Bar and Consolidation Bar" patterns is very powerful for Price Action trading. - Indicator detects Engulfing Bars and Consolidation Bars on chart: - Bullish Engulfing Bar pattern - Green arrow signal on chart. - Bearish Engulfing Bar pattern - Orange arrow signal on chart. - Bullish Consolidation Bar pattern - Blue arrow signal on chart. - Bearish Consolidation Bar pattern - Red ar
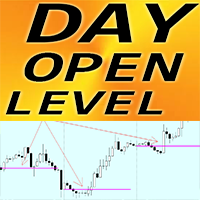
Crypto_Forex Indicator DAY OPEN LEVEL for MT4.
- Indicator "Day Open Level" is very useful auxiliary indicator. - OPEN day level is so important because very often price returns to that area during the day. - Indicator shows you daily open line for each day. - It is useful for intraday traders to set up targets or use as support/resistance area. - Day Open Level indicator can be used for Reversal intraday trading.
// Great Trading Robots and Indicators are available here: https://www.mql5.com
Do you know why the MetaTrader Market is the best place to sell trading strategies and technical indicators? No need for advertising or software protection, no payment troubles. Everything is provided in the MetaTrader Market.
You are missing trading opportunities:
- Free trading apps
- Over 8,000 signals for copying
- Economic news for exploring financial markets
Registration
Log in
If you do not have an account, please register
Allow the use of cookies to log in to the MQL5.com website.
Please enable the necessary setting in your browser, otherwise you will not be able to log in.