Watch the Market tutorial videos on YouTube
How to buy а trading robot or an indicator
Run your EA on
virtual hosting
virtual hosting
Test аn indicator/trading robot before buying
Want to earn in the Market?
How to present a product for a sell-through
New Technical Indicators for MetaTrader 4 - 3

New Update of Smart Trend Trading System MT5 For 2026 Market: If You Buy this Indicator you will Get my Professional Trade Manager + EA for FREE . First of all Its worth emphasizing here that this Trading System is Non-Repainting , Non Redrawing and Non Lagging Indicator Which makes it ideal from both manual and robot trading . [Online course] , [manual] and [download presets] . The Smart Trend Trading System MT5 is a comprehensive trading solution tailored for new and e
Speed Trend Matrix Ultimate (Version 5.10) Speed Trend Matrix (STM) is a comprehensive trading system wrapped into a single indicator. Unlike standard oscillators that simply show overbought or oversold conditions, the STM analyzes the "velocity" of price movement relative to market volatility (ATR). It identifies not just the trend direction, but the strength behind the move, filtering out low-momentum "flat" periods where traders often get caught in whipsaws. This tool is designed for traders
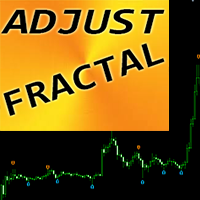
"Adjustable Fractals" - is an advanced version of fractal indicator, very useful trading tool! As we know Standard fractals mt4 indicator does not have settings at all - this is very inconvenient for traders. Adjustable Fractals has resolved that issue - it has all necessary settings: Adjustable period of indicator (recommended values - above 7). Adjustable distance from Highs/Lows of price. Adjustable design o f fractal arrows. Indicator has built-in Mobile and PC alerts.
Click here

TREND LINES PRO - This is a professional tool that automatically reveals real turning points And re-entries major players, and also displays global levels of higher timeframes, which makes it indispensable for comprehensive market analysis.
Thanks to reliable filtering of market noise and a well-thought-out algorithm, signals remain stable and don't repaint. This allows traders to be confident in the objectivity of the data they receive and the correctness
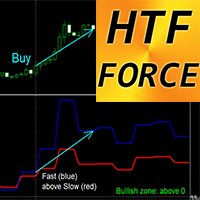
Crypto_Forex Indicator HTF Force Oscillator for MT4.
- HTF Force is powerful indicator for Multi-Time Frame trading. HTF means - Higher Time Frame. - Force index is one of the top indicators that combines price and volume data into a single value. - Values from Higher time frame can show you the trend direction (downtrend - below 0; uptrend - above 0). - Fast Force_indicator - Blue line, Slow Force_indicator - Red line. - Buy signal - Fast line crosses Slow line upward and both - above 0 (see
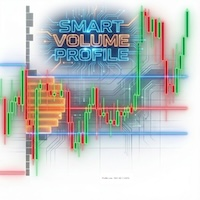
English Scan for "Smart Money" (Volume Markers): Arrows indicate abnormal volume (higher than average) with clear green/red color coding. This helps identify "Smart Money" entries and filter out fake signals. Critical Alerts: No need to stare at the screen. The system notifies you immediately when the price crosses the POC (Point of Control), which is often a decisive point for trend continuation or reversal. Instant Market Structure (Developing Profile): Displays the profile of the current form
The High Low Cloud Trend indicator is a channel-based technical analysis tool that identifies trend direction and mean reversion opportunities through adaptive price boundaries. The system operates by calculating the highest high and lowest low over a specified lookback period, creating outer channel boundaries that define the overall price range. A secondary inner channel uses a shorter period (one-quarter of the main lookback) to capture more immediate price movements within the broader range.
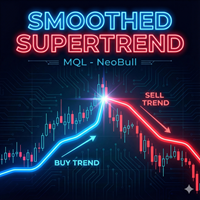
Smoothed Supertrend Indicator - Volatility-Based Trend Indicator with Smoothing Function The Smoothed Supertrend Indicator is an enhanced variant of the classic Supertrend indicator for MetaTrader 4 . By integrating an additional smoothing function, market noise is reduced and the quality of trend signals is improved. Technical Description: The indicator is based on the Average True Range (ATR) for measuring market volatility and combines it with Moving Average smoothing of price data. The resul
FREE

English ICT_SuperTrend is an "All-in-One" tool designed to help traders see the complete market picture without needing to open multiple overlapping windows. Here are the main advantages of this indicator: Hybrid Trading System The biggest advantage of this tool is combining Trend Following with Smart Money Concepts / ICT (Price Structure) . SuperTrend: Tells the main market direction, whether to look for Buy or Sell trades. ICT Concepts: Identifies structural key points such as important suppor
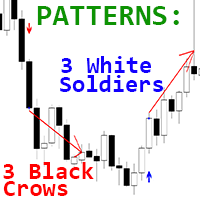
Crypto_Forex Indicator "3 White Soldiers & 3 Black Crows patterns" for MT4, No repaint, No delay.
- Indicator "3 White Soldiers & 3 Black Crows" is very powerful for Price Action trading. - Indicator detects 3 White Soldiers and 3 Black Crows patterns on chart. - Bullish 3 White Soldiers pattern - Blue arrow signal on chart (see pictures). - Bearish 3 Black Crows pattern - Red arrow signal on chart (see pictures). - With PC, Mobile & Email alerts. - Indicator "3 White Soldiers & 3 Black Crows"
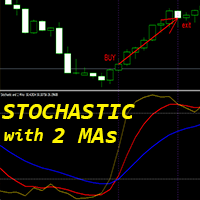
Crypto_Forex Indicator "Stochastic and 2 Moving Averages" for MT4, No Repaint.
- Stochastic oscillator is one of the best indicators on the market - perfect tool for many traders. - "Stochastic and 2 Moving Averages" Indicator allows you to see Fast and Slow Moving Averages of Stochastic oscillator. - OverBought zone - above 80; OverSold one - below 20. - It is great to take Sell entries from above 80 zone and Buy entries from below 20. - You can see Buy and Sell entry conditions on the pictur
This indicator is a kind of strategy that uses lines to build certain candle readings that will help the trader in his calculations and trading.
The indicator itself is a regular Moving Average, which is colored in two colors: light and dark, and thus shows the trader the nature of market behavior in the current situation at a given time and, depending on the color indication, indicates which trades are best opened at this stage of time: either to buy, or for sale.
But the vertical and horizo
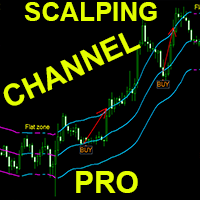
Crypto_Forex Indicator "Scalping Channel Pro" for MT4.
- Scalping Channel Pro has ATR-based volatility borders. - Great to use for scalping trading: - Enter in trades via arrangement pending limit order on the middle line. - Consider Bullish entries when blue steady upward channel takes place and at least 1 candle was closed above top border (see pictures). - Consider Bearish entries when red steady downward channel takes place and at least 1 candle was closed below bottom border (see pictures
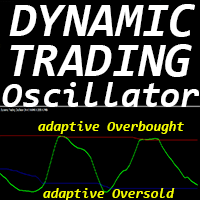
"Dynamic Trading Oscillator" - is an advanced custom Crypto_Forex indicator - efficient Trading tool for MT4!
- New generation of Oscillators - see pictures to check how to use it. - Dynamic Trading Oscillator has adaptive Oversold/Overbought zones. - Oscillator is an auxiliary tool to find exact entry points from dynamic OverSold/OverBought areas. - Oversold values: below Blue line, Overbought values: above Red line . - This indicator is great to combine with Price Action patterns as well. -
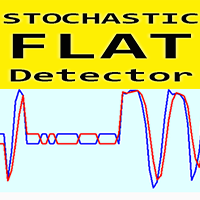
Crypto_Forex Indicator STOCHASTIC FLAT Detector - is an efficient auxiliary tool in trading! No Repaint. I offer you to upgrade your trading methods with this great indicator for MT4.
- Indicator shows price Flat areas on the chart. It has "Flat sensitivity" parameter - which is responsible for flat detection. - STOCHASTIC FLAT Detector can be used for Price Action entries confirmation, Divergence or OverSold/OverBought signals. - You can use it for trend following systems to detect flat zones
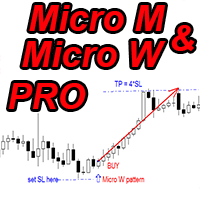
Crypto_Forex Indicator "Micro M and Micro W patterns Pro" for MT4, No repaint, No delay.
- Indicator "Micro M and Micro W patterns Pro" is very powerful indicator for Price Action trading. - Indicator detects Micro M pattern and Micro W pattern on chart: - Bullish Micro W - Blue arrow signal on chart (see pictures). - Bearish Micro M - Red arrow signal on chart (see pictures). - With built-in PC and Mobile alerts. - Indicator "Micro M and Micro W patterns Pro" is excellent to combine with Supp

Indicator: Currency Strength Meter Pro Market Breadth Visualization Pros: Instead of looking at cluttered charts, this indicator displays data in a clean "Dashboard" format. Traders can instantly scan and know which pairs are the strongest or weakest. Benefits: Saves time checking individual charts and helps make faster trading decisions on pair selection. Auto-Ranking & Sorting Pros: Features a "Horizontal Ranking" mode which automatically sorts pairs from "Strongest" to "Weakest". Benefits: Al

The official release price is $65 only for the first 10 copies, the next price is $125 Gold Scalper System is a multifunctional trading system that combines a breakout strategy for key liquidity levels with confirmation and a built-in Smart DOM Pro module for market depth analysis. The system identifies zones of limit order accumulation, tracks activity at support and resistance levels, and generates signals at the moment of their breakout.
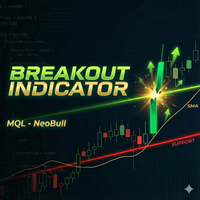
NeoBull Breakout Indicator - Professional Breakout Trading Made Easy The NeoBull Breakout Indicator is a powerful technical indicator for MetaTrader 4 , specifically designed for breakout traders. It combines proven Highest High/Lowest Low levels with the SMA 200 trend filter to identify high-probability breakout setups. Main Features: Stepped Highest High (20) Line - Shows the highest high of the last 20 periods as a clear, horizontal line (like in TradingView) Stepped Lowest Low (20) Line - S
FREE

Ultimate Daily SR Zones + Rejection Arrows Ultimate Daily SR Zones is a powerful price-action indicator that helps traders clearly identify the most important daily market levels — the previous day’s High , Low , Midline , and opening/closing reference points.
It also detects wick rejection signals and plots automatic Buy and Sell arrows when the market rejects these zones. This tool is perfect for intraday and swing traders who use daily levels for breakout, reversal, or retest strategies. Wh

Ultimate Super Rejection Zones is a powerful MT4 indicator designed to detect accurate intraday reversal points using a combination of: Previous Day High & Low Midline equilibrium zone Rejection candle patterns Double-layer confirmation using two Stochastic filters Smart alert and arrow system Daily auto-reset filtering Optional trend filter using Moving Averages The indicator helps traders find high-probability reversal entries at premium and discount zones.
It automatically marks: ️ Sell Reje

# CurrencyMeter Pro - Professional Multi-Market Strength Analyzer
## Overview
CurrencyMeter Pro is a powerful real-time momentum analyzer that tracks the strength of currencies, cryptocurrencies, indices, metals, and energy markets at a glance. Make smarter trading decisions by instantly identifying the strongest and weakest instruments across multiple asset classes.
Whether you're a forex trader looking to pair strong currencies against weak ones, or a multi-asset trader seeking momentum co

ALGO Smart Flow Structure Indicator The institutional standard for market structure. Designed for serious SMC (Smart Money Concepts) and Price Action traders, this indicator eliminates the noise of conventional fractals. Forget about repainting signals and ambiguity; get a crystal-clear view of the real market structure , validated by strict algorithmic rules. The Bias Dashboard Make informed decisions by monitoring 3 critical variables across 8 simultaneous timeframes (MN1, W1, D1, H4,
Most traders want to use Andrews’ Pitchfork, but manually plotting the three anchor points is slow, inconsistent, and easy to get wrong. This is one of the main reasons pitchforks are underused, despite being one of the most effective tools for defining structure, channels, and reaction zones. Instant Pitchfork solves this. With one anchor point and a single click, it draws a perfectly aligned Andrews’, Schiff, or Modified Schiff pitchfork — following the correct rules from swing to swing to sw
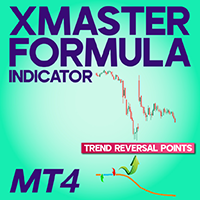
XMaster XHMaster Formula MT4 Indicator – No Repaint Strategy The XMaster / XHMaster Formula Indicator for MetaTrader 4 (MT4) is one of the most popular non-repaint tools used in Forex trading. According to sources like XS.com and TradingFinder, the indicator is designed to detect market direction, momentum strength, and potential reversal areas with high accuracy. This MT4 version blends multiple technical elements—such as EMA-based trend analysis, MACD momentum, RSI and Stochastic oscillators,
FREE
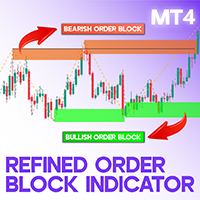
Refined Order Block Indicator MetaTrader 4 The Refined Order Block (OBR) indicator is a specialized tool designed for traders who follow ICT and Smart Money (SMC) methodologies on the MetaTrader 4 (MT4) platform. This indicator highlights bullish order blocks in green and bearish order blocks in brown, helping traders identify critical market zones. Order block regions are key price areas where significant institutional orders can increase the likelihood of trend reversals or directional shifts

Reversal Super Pro - The best trend-following trading indicator!!!
Precise entry points for currencies, cryptocurrencies, metals, stocks, and indices! Indicator 100% does not repaint!!! Once a signal appears, it never disappears! Unlike indicators that repaint, which can lead to loss of deposits because they can display a signal and then remove it. It is not recommended to use it alone, only with an additional trend indicator.
Bonus: When you purchase the indicator, you receive the Trend Arro

The ARM Pro indicator is an excellent tool that will enhance traders' market analysis by combining trend identification with entry points and reversal alerts. This indicator allows users to confidently and accurately navigate the complexities of the Forex market. Key benefits: · Works on MT4 · Clear buy and sell signals · Doesn't repaint · Works on all assets
Indicator 100% does not repaint!!! Once a signal appears, it never disappears (wait for the current price to close)! This is unlike i
Performance Analytics 1.4 is an advanced real-time performance-tracking and risk-management indicator designed for traders who work with multiple EAs or simultaneous setups and need accurate, persistent, instance-separated metrics.
It displays on-screen key statistics for both the entire account and the current EA, including profits, maximum losses, professional performance metrics, and smart alerts. The indicator visually divides the information into two independent blocks : 1. White Block – Ge

English Version Overview OPR Median Pro is a powerful indicator designed for traders using the Open Price Range (OPR) strategy.
It automatically detects the market’s opening range and plots: The upper and lower OPR boundaries The median line And extends these levels throughout your trading session Key Features Automatic OPR detection (customizable time window) Accurate plotting of range boundaries and median line Auto-extension of levels across the session Visual and sound alerts when
Unveiling Quantum Signal Pro: Your Edge in the Market! Are you tired of second-guessing your trading decisions? Do you wish you had a clearer, more precise way to spot market trends and potential reversals? Look no further! Quantum Signal Pro is here to transform your trading experience, offering a sophisticated yet easy-to-understand system that cuts through the market noise to deliver actionable insights. Imagine having a reliable partner that guides you to high-probability trade setups, confi
FREE

Trend Alchemist: Turn Market Chaos into Trading Gold! Are you tired of conflicting signals and getting caught on the wrong side of the trend? The Trend Alchemist indicator cuts through the noise to give you clear, high-probability entry and exit points. This powerful system combines the reliable trend filtering of Multiple Exponential Moving Averages (EMAs) with the precise timing of the Stochastic Oscillator . It doesn't just show you the trend; it confirms the market alignment and pinpoints t
FREE

Conquer the Market with Velocity Crossover ! Stop guessing and start trading with confidence . The Velocity Crossover indicator is your powerful tool to pinpoint high-probability entries and exits, combining the best of Moving Averages (MA) and MACD momentum into crystal-clear trading signals. This isn't just another average indicator; it's a smart confirmation engine . It waits for the price to cross a key MA and then cross-references that movement with the powerful shift in the MACD's momentu
FREE

Unleash Precision Trading with Fusion Multi-Trend Pro Are you tired of conflicting signals and missed opportunities? Introducing the Fusion Multi-Trend Pro , the indicator engineered to cut through market noise and deliver high-convection entry and exit points. This isn't just another indicator; it's a unified trading assistant that merges the power of momentum, trend, and volatility into a clear, decisive signal. Key Advantages: Why You Need Fusion Multi-Trend Pro Filter Out the Fakes: Our
FREE
SuperTrend Pro (MT4 Version) - The Ultimate Trend Following System
Unlock the full potential of the SuperTrend indicator with the Pro version. Designed for serious traders who need more than just a simple line. SuperTrend Pro is not just an indicator; it is a complete trading system. It combines the proven reliability of the classic SuperTrend with advanced Multi-Timeframe (MTF) analysis and Smart Filtering to give you the highest probability setups. Why SuperTrend Pro? Trading with a sing
The Trend Duration Forecast MT4 indicator is designed to estimate the probable lifespan of a bullish or bearish trend. Using a Hull Moving Average (HMA) to detect directional shifts, it tracks the duration of each historical trend and calculates an average to forecast how long the current trend is statistically likely to continue. This allows traders to visualize both real-time trend strength and potential exhaustion zones with exceptional clarity. KEY FEATURES Dynamic Trend Detection: Uti
Product Name: Combined KD Enhanced Multi-Signal Stochastic Indicator Core Benefits: - **Signals in 1 Glance**: Red (buy) / green (sell) arrows + dual curves; auto-marked 20/80 overbought/oversold zones – no complex math needed. - **All-Market Fit**: Default KD(9,3,3); customizable settings work for stocks/forex/futures (any MT5 timeframe: M1-MN1). - **Lag-Free Performance**: 20% faster than official MT5 Stochastic – smooth loading even on large historical datasets.
Key Features: -
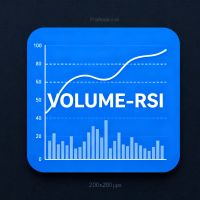
Short product tagline Volume‑RSI is a professional MT4 indicator that applies the classic RSI formula to bullish and bearish volume, showing whether buyers or sellers dominate the market. Main description (English) Volume‑RSI is a custom MetaTrader 4 indicator that measures the relative strength of bullish and bearish volume instead of price. It behaves like a classic RSI oscillator, but the input is up‑volume and down‑volume, so you immediately see whether real trading activity supports the pri

Power MACD indicator for MT4 with the features: 1. MACD Calculation: Fast EMA (default: 12) Slow EMA (default: 26) Signal line SMA (default: 9) Histogram with color-coded bars (green up, red down) 2. Multiple Signal Types (can be enabled/disabled): Zero Line Cross : Signals when MACD crosses above/below zero MACD/Signal Cross : Signals when MACD crosses Signal line Histogram Change : Signals when histogram changes direction, with a Sensitivity factor 3. Visual Indicators: Arrows on the main pric

Order Blocks SMT is not “just another indicator”.
It’s the tool that lets you read institutional order flow and make decisions with the same logic used by banks and funds – directly in MetaTrader 5 (MT5) . What this MT5 Order Blocks Indicator Does for You With Order Blocks SMT (an advanced Smart Money / ICT Order Blocks indicator for MT5), you can: Stop guessing supply & demand and start trading clear, objective, repeatable levels . See on one chart the Order Blocks from up
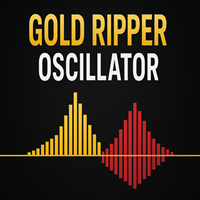
The Gold Ripper Oscillator is a specialized momentum-pressure gauge designed for XAUUSD. It visualizes the real-time tug-of-war between bullish gold strength (“GoldRush”) and opposing USD pressure (“USDCrush”). The indicator displays two color-coded histogram streams that expand or contract based on shifting market drive. When the gold side dominates, golden bars rise above the baseline, reflecting strong upward energy. When USD-driven weakness takes control, crimson bars form below the baseline
Commodity Channel Index. Не рисующий индикатор для отображения старшего таймфрейма (далее ТФ) на текущем графике. Возможно использовать на текущем ТФ. Несколько вариантов расчета по различным ценам и используемым мувингам. Параметры: TimeFrame - должен быть больше равен текущему. Period - должен быть больше 1. Price Type - варианты: Close, High, Low, Median, Typical, Weighted, Average, Body, Median, Trend Biased. MA Metod - метод вычисления на основе МА: SMA, EMA, SMMA, LWMA, LSMA, WEMA. Sm

Super IA Channel Creator PRO Intelligent Adaptive Channels & Smart Trade Context Super IA Channel Creator PRO is an advanced market-structure and decision-support indicator for MetaTrader 4 , designed to help traders clearly identify high-probability trading zones , context strength , and price reaction behavior in real time. This is not a repainting tool and not a simple channel indicator.
It is a complete decision framework built around adaptive price channels, smart scoring, and visual confir

SUPER IA SNIPER – VOLUME PRO (MT4) Super IA Sniper – Volume PRO is an advanced volume and price-behavior analysis indicator , designed to identify high-probability short-term reversal conditions based on qualified volume events , using closed candles only (NO REPAINT) . It was built for traders who demand precision, transparency, and real statistical validation , eliminating random signals and purely subjective market interpretations. WHAT THE INDICATOR ANALYZES The indicator continuously

Hello friends. I am very proud to introduce you to this new indicator that I have been working on for a while. Drag the indicator to the xauusd chart on the 1-minute time frame and enjoy. The indicator will tell you when a buy or sell signal occurs. You can place your stop loss order at the end of the buy or sell arrows. Please be careful, keep your account management and transaction amount at a level that will not make you sad about possible loss of money. Good trading.

Gold Pattern Scanner Pro Gold Pattern Scanner Pro automatically detects trend channels and rising/falling wedges directly on your chart, using an Autochartist-style approach. It draws clean upper/lower trendlines, calculates the current price position inside the pattern , and sends smart alerts (including push notifications) when price touches the channel boundaries. Designed especially for GOLD (XAUUSD).
It can be applied to other symbols such as forex pairs, indices, or crypto. Main Features
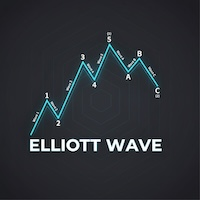
Automated Elliott Wave Theory 1. Automated Wave Counting & Reduced Bias (Objectivity) Normally, Elliott Wave counting involves a lot of "imagination" or personal opinion. This indicator helps by: Finding Impulse Waves (Waves 1-2-3-4-5): Uses strict rules (e.g., Wave 3 cannot be the shortest, Wave 4 cannot overlap Wave 1) to show you the theoretically correct price structure. Finding Corrective Waves (Waves A-B-C): Helps catch price retracements to find opportunities to re-enter the trade with t

Market Time Watch A clean, lightweight and essential time-tracking tool for every trader Market Time Watch is a professional on-chart time display designed for traders who need an accurate real-time clock and precise candle timing while analyzing the markets. This tool helps you instantly see current local time , server time , and candle countdown directly on your chart without any clutter or heavy UI components. Whether you scalp fast markets, swing-trade sessions, or simply need a clean time r
FREE
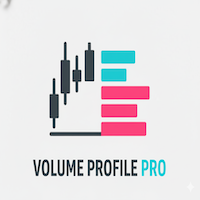
Volume Profile Pro Indicator This indicator is the Volume Profile Pro tool, designed to help analyze "at which price level the most trading activity occurred." It comes with these additional special capabilities: 1. Display Modes Volume Profile (Standard): Shows the Total Volume at each price range to visualize key support and resistance zones. Delta / Money Flow: Shows the "difference" between Buy and Sell pressure ( Buy vs Sell ) to indicate who controls the market at that price. You can choos
Product Title Smart ZigZag (MT4) – part of the SmartView series
See also >> Smart ZigZag Pro Short Description A new-generation ZigZag indicator for MT4 with an on-chart Smart Control Panel, one-click visibility management, dynamic buffer value display on hover, and a modern inputs window. Features Dual‑color ZigZag that solves the single‑line color limitation; designed to work seamlessly with the full SmartView Indicators series. Overview Smart ZigZag focuses on user experience: a compact pa
FREE
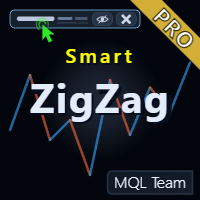
Product Title Smart ZigZag Pro (MT4) – part of the SmartView Indicators series Short Description The professional edition of the ZigZag indicator with an on-chart Smart Control Panel, advanced analytical tools, dynamic support/resistance levels, automatic trading signals, pattern recognition, wave statistics, and comprehensive customization for all elements. The Free version shares the SmartView Panel feature with the Pro version. Overview Smart ZigZag Pro is the professional edition of the Smar

Product Title Smart Parabolic SAR (MT4) – part of the SmartView series Short Description A new-generation Parabolic SAR indicator for MT4 with an on-chart Smart Control Panel, one-click visibility management, dynamic buffer value display on hover, and a modern inputs window; designed to work seamlessly with the full SmartView Indicators series. Overview Smart Parabolic SAR focuses on user experience: a compact panel on the chart shows the key settings at a glance, lets you open the native inputs
FREE
This is Free product you are welcome to use for your needs!
Also I very appreciate your positive feedbacks! Thanks a lot!
// Great Trading Robots and Indicators are available here: https://www.mql5.com/en/users/def1380/seller
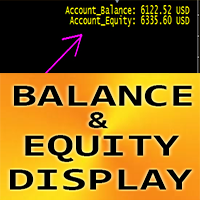
Crypto_Forex Indicator "Balance and Equity Display" for MT4 , great auxiliary trading tool.
- This indicator shows current Balance and Equity of account. - It is possible to locate display values in any corner of the chart: 0 - for top-left corner, 1 - top-right, 2 -
FREE

Product Title Smart Bollinger Bands (MT4) – part of the SmartView series Short Description A new-generation Bollinger Bands indicator for MT4 with an on-chart Smart Control Panel, one-click visibility management, dynamic buffer value display on hover, and a modern inputs window; designed to work seamlessly with the full SmartView Indicators series. Overview Smart Bollinger Bands focuses on user experience: a compact panel on the chart shows the key settings at a glance, lets you open the native
FREE
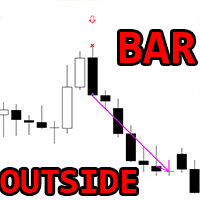
Crypto_Forex Indicator OUTSIDE Bar Pattern for MT4, No repaint, No delay.
- Indicator "OUTSIDE Bar" is a very powerful indicator for Price Action trading. - Indicator detects OUTSIDE Bar patterns on chart: - Bullish OUTSIDE Bar - Blue arrow signal on chart (see pictures). - Bearish OUTSIDE Bar - Red arrow signal on chart (see pictures). - With PC, Mobile & Email alerts. - Indicator "OUTSIDE Bar Pattern" is excellent to combine with Support/Resistance Levels.
// Great Trading Robots and Indica
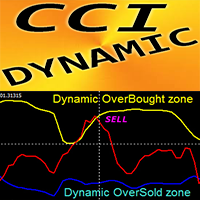
Crypto_Forex Indicator "CCI with Dynamic OverSold/OverBought zones" for MT4, No Repaint.
- Commodity Channel Index (CCI) is excellent for Momentum trading into the trend direction. - It is great to take Sell entries from dynamic OverBought zone and Buy entries from dynamic OverSold zone into the direction of main trend. - This indicator is excellent to combine with Price Action entries as well. - Dynamic OverBought zone - above yellow line. - Dynamic OverSold zone - below blue line. - CCI osci
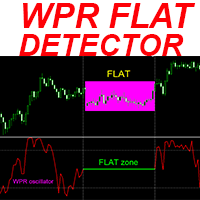
Crypto_Forex Indicator "WPR FLAT Detector" - is an efficient auxiliary tool in trading! No Repaint. I offer you to upgrade your trading methods with this great indicator for MT4.
- Indicator shows price Flat areas on the chart. It has "Flat sensitivity" parameter - which is responsible for flat detection. - "WPR FLAT Detector" can be used for Price Action entries confirmation or in combination with other indicators. - You can use it for trend following systems to detect flat zones and avoid tr
Squeeze Momentum Alert 1. Identifies Price "Explosion" Points (The "Squeeze") The greatest advantage of this indicator is its ability to catch periods where the market is "consolidating" or "gathering energy" before a massive move. Why it's good: Markets cycle between periods of calm (consolidation) and bursts of volatility (explosions). This tool tells you, "The chart is currently compressing tightly; get ready for the next big surge," ensuring you don't miss the start of a major trend. 2. Dist
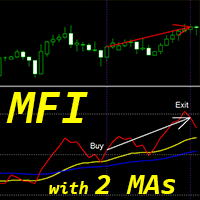
Crypto_Forex Indicator "MFI and 2 Moving Averages" for MT4, No Repaint.
- Money Flow Index (MFI) is a technical oscillator which uses price and volume data for identifying oversold and overbought zones. - "MFI and 2 Moving Averages" Indicator allows you to see Fast and Slow Moving Averages of MFI oscillator. - Indicator gives opportunities to see the trend change very early. - It is very easy to set up this indicator via parameters, it can be used on any timeframe. - You can see Buy and Sell e

Confluence+ is a multi-factor indicator designed to identify trading signals by combining trend, momentum, and volume. Thanks to its dynamic confluence system, it only generates signals when multiple technical conditions align, effectively reducing false signals. Main features: Adaptive trend detection (dynamic MA + ATR) Multi-timeframe confirmation (M15 to D1) Advanced momentum filter (RSI, Stochastic, divergences) Volume and volatility analysis (automated ratios) Real-time confluence score (0–
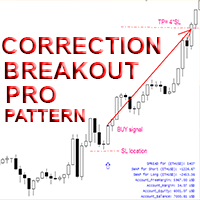
Crypto_Forex Indicator "Correction Breakout Pro pattern" for MT4, No repaint, No delay.
- Indicator "Correction Breakout Pro pattern" is very powerful indicator for Price Action trading with high profit potential. - Indicator detects bullish and bearish Breakout bars after the price correction: - Bullish Correction Breakout pattern - Blue arrow signal on chart (see pictures). - Bearish Correction Breakout pattern - Red arrow signal on chart (see pictures). - With PC and Mobile alerts. - Indic
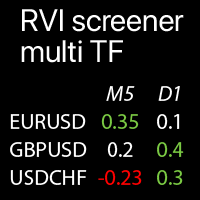
Multi-timeframe RVI values on the selected Symbols: compare the current market trends The indicator displays Relative Vigor Index values from all selected timeframes and Symbols in a single table , which allows you to quickly analyze current market price trends . My multifunctional utility : 66+ features | Contact me for any questions | MT5 version Each Symbol can be customized: removed or replaced. You can add up to 40 Symbols. Panel can
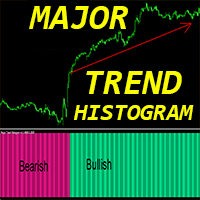
Crypto_Forex Indicator "Major_Trend_Histogram" for MT4, No Repaint.
- Major_Trend_Histogram indicator designed to catch really huge trends. - Indicator can be in 2 colors: Pink for bearish trend and Green for bullish one (colors can be changed). - It detects trends on the beginning stages - way more efficient than any standard MA. - Major_Trend_Histogram can be combined with any other trading methods: Price Action, VSA, other indicators. - Indicator has built-in Mobile and PC alerts.
// Great
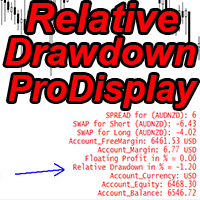
Crypto_Forex Indicator "Relative Drawdown Pro Display" for MT4, useful trading tool.
This is MUST HAVE indicator for traders who use grid trading systems!!!
- Relative Drawdown Pro Display indicator shows current Relative DD or Floating Profit in % on your account. - PC and Mobile Alerts are built-in with adjustable Trigger level. - It indicates current Spread and Swaps of forex pair where it is attached. - Indicator also shows account Balance, Equity and Margins. - It is possible to locate
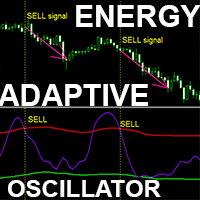
Advanced custom Crypto_Forex indicator "Adaptive Energy Oscillator" - efficient auxiliary trading tool for MT4!
- This indicator is a New generation of Oscillators. - "Adaptive Energy Oscillator" has adjustable adaptive Oversold/Overbought zones. - This is a technical momentum indicator which is very useful on trend markets. - Oscillator is an auxiliary tool to find exact entry points from OverSold/OverBought areas into the direction of main trend. - Adaptive Oversold zone: below the Green li
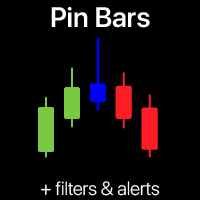
Pin Bar Pattern scanner | Smart alerts and Trend filter Never miss a high-probability Pin Bar reversal again! This automated Pin Bar Pattern scanner does the heavy lifting for you.
This trading tool scans your charts in real-time, identifies the powerful Pin Bar (Hammer/Shooting Star) pattern, and sends you instant signals. Trading indicator is designed for both novice and expert traders who want to harness the power of pure price action without the guesswork. My multifunctional utility :
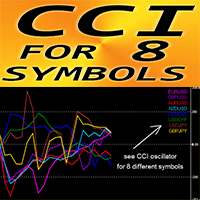
Forex Indicator "CCI for 8 Symbols" for MT4, No repaint.
- CCI is one of the most popular oscillators for trading. - Commodity_Channel_Index (CCI) measures the difference between the current price and the historical average price. - Important levels: +/-200. - It is great to take Sell entries from above +200 zone and Buy entries from below -200. - "CCI for 8 Symbols" gives opportunity to control CCI values of up to 8 different symbols just on 1 chart. - This indicator is excellent to combine w
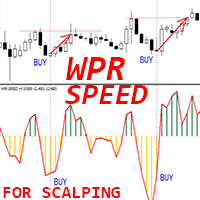
Crypto_Forex Indicator "WPR SPEED" for MT4 - great predictive tool, No Repaint.
- The calculation of this indicator is based on equations from physics. WPR SPEED is the 1st derivative of WPR oscillator itself. - WPR SPEED is good for scalping entries on sideways and flat markets. - WPR SPEED indicator shows how fast WPR itself changes its direction - it is very sensitive. - It is recommended to use WPR SPEED indicator for momentum scalping trading strategies: find big size peaks of indicator -

Ultimate Market Master Trend Master the Market’s Direction with Precision The Ultimate Market Master Trend indicator is an all-in-one market sentiment analyser designed for traders who demand clarity, accuracy, and confidence in every move.
It combines smart trend detection , multi-timeframe stochastic momentum , and dynamic visual cues to help you identify high-probability entries and exits with ease. Key Features 1. Smart Trend System (Main Chart) Uses a 200-period LWMA baseline to determin
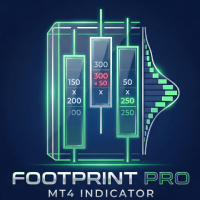
PROFESSIONAL FOOTPRINT CHART INDICATOR
A Footprint Chart is an advanced order flow visualization tool that displays the volume traded at each price level within a candlestick. Unlike traditional candlestick charts that only show open, high, low, and close prices, footprint charts reveal the battle between buyers and sellers at every price level. KEY CONCEPT: Footprint charts show WHERE volume occurred, not just HOW MUCH volume occurred. This is critical for understanding institutional ac
Do you know why the MetaTrader Market is the best place to sell trading strategies and technical indicators? No need for advertising or software protection, no payment troubles. Everything is provided in the MetaTrader Market.
You are missing trading opportunities:
- Free trading apps
- Over 8,000 signals for copying
- Economic news for exploring financial markets
Registration
Log in
If you do not have an account, please register
Allow the use of cookies to log in to the MQL5.com website.
Please enable the necessary setting in your browser, otherwise you will not be able to log in.