Watch the Market tutorial videos on YouTube
How to buy а trading robot or an indicator
Run your EA on
virtual hosting
virtual hosting
Test аn indicator/trading robot before buying
Want to earn in the Market?
How to present a product for a sell-through
New Technical Indicators for MetaTrader 4 - 4

DESCRIPTION: Discover the power of adaptation with Adaptive RSI Bands, a revolutionary indicator based on the concepts of self-adaptive trading rules. Unlike traditional RSI with static levels of 70 and 30, this indicator “breathes” with the market, dynamically adjusting its overbought and oversold bands according to recent volatility.
Why use Adaptive RSI Bands? Markets are not static. An RSI level of 70 may be significant in a sideways market, but irrelevant in a strong trend. This indicator
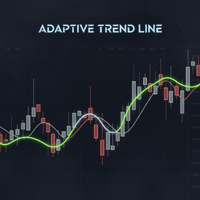
Adaptive Trend Line is not an ordinary moving average. It is an intelligent trend line that changes color based on the internal strength of the market, as measured by the RSI.
How does it work? It combines the smoothness of an Exponential Moving Average (EMA) with the sensitivity of the RSI. - Green Line: The RSI is above 55, indicating that buyers are in control. - Red Line: The RSI is below 45, indicating that sellers are in control. - Gray Line: The RSI is in the neutral zone (45-55), indic
Volatility Matrix – Session Volatility Analyzer Volatility Matrix analyzes current market volatility against historical sessions to detect anomalies and predict potential breakouts. The indicator compares current volatility with more than 200 historical sessions from the same hour and day of the week, calculating Z-Scores to identify when volatility deviates from typical ranges. Features Real-time Z-Score monitoring and display Historical session matching (same hour/day of week) Dynamic price zo
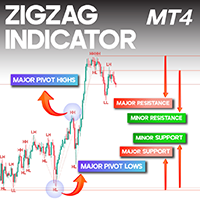
ZigZag Indicator for MetaTrader 4 The ZigZag Indicator in MetaTrader 4 is widely used for identifying significant highs and lows—known as pivot points —directly on the price chart. By marking both Major and Minor pivots, it helps traders recognize potential reversal zones and understand overall market structure. Each pivot is labeled as HH, HL, LH, or LL , making it easier to detect dominant trends as well as short-term price movements. Spotting these peaks and troughs is a vital component of te
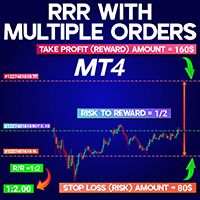
Risk to Reward Ratio Multiple Orders MT4 Risk to Reward Ratio Multiple Orders MT4 is a dedicated MetaTrader 4 indicator designed to help traders accurately monitor the relationship between stop loss (SL) and take profit (TP) levels in real time. When a trade is opened in MT4 with defined SL and TP, this tool calculates the distance between these levels relative to the entry price and displays the risk/reward ratio in the top-left corner of the chart. This feature is particularly useful for manag

TrendScan is a visual scanner that detects bullish, bearish, or neutral trends across multiple symbols and timeframes. It analyzes market structure, EMA alignment, and price range to display clean, reliable signals. Ideal for traders seeking clarity and speed in their analysis.
Compatible with up to 25 symbols. Support for 8 timeframes. Advanced trend filters. Compact and customizable visual interface.
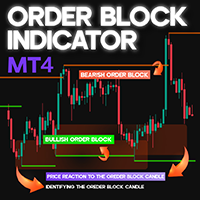
Order Block Indicator for ICT and Smart Money Trading in MT4 The Order Block Indicator is an important tool for traders using ICT (Inner Circle Trader) and Smart Money Concepts on the MetaTrader 4 (MT4) platform.
This indicator highlights key price zones where institutional orders are likely positioned, helping traders identify potential reversal points and strong reaction levels.
Bullish order blocks are displayed in green , while bearish ones appear in brown . When price enters these zones, it
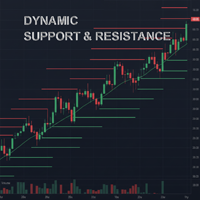
Forget about drawing lines manually. Dynamic Support x Resistance automatically identifies critical price levels based on the market structure of higher time frames. Inspired by institutional strategies, this indicator projects the significant highs and lows of the last few days (or the period you choose) directly onto your trading chart.
Why is it different?
Many support and resistance indicators are too complex or subjective. This indicator uses pure, hard logic: “If the price breaks the hi
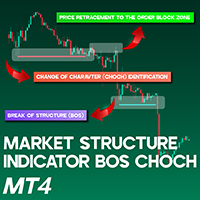
Market Structure Indicator BOS CHOCH MT4 The BOS-CHOCH Market Structure Indicator is an ICT-inspired tool developed for MetaTrader 4 (MT4). It is designed to help traders who follow ICT methodologies identify shifts in both dominant and secondary market trends. By pinpointing structural breaks and changes in market character, this indicator enhances technical analysis and supports more accurate trading decisions.
Market Structure Indicator (BOS-CHOCH) Overview Below are the general details and

MULTI INDICATOR SCANNER - PROFESSIONAL EDITION
PRODUCT DESCRIPTION
Multi Indicator Scanner is the most comprehensive technical analysis scanner on the market. It analyzes 10 different indicators simultaneously and provides you with clear BUY-SELL-NEUTRAL signals. No more checking dozens of indicators one by one!
Multi Pivot Indicator - Professional Trading Tool MULTI
PIVOT PRO INDICATOR Professional Multi Pivot Indicator for MT4 5-in-1 Pivot Indicator Professional Trading Tool for MetaTrader 4 ENGLISH TÜRKÇE Multi Pivot Indicator PRO Classic Fibonacci Camarilla Woodie DM What is Multi Pivot Indicator? Multi Pivot Indicator is a professional trading tool that displays 5 different pivot calculation methods on your MetaTrader 4 charts. Pivot points are critical support and resistance
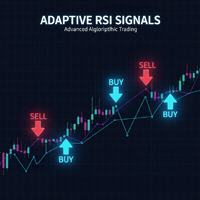
Adaptive RSI Signals is the complete implementation of the Auto-Adaptive Trading Rules strategy. This indicator combines market structure (Dynamic Support and Resistance) with the intelligence of Adaptive RSI to generate high-probability buy and sell signals directly on your chart.
What is the strategy? The indicator looks for extreme situations where the price has broken a key support or resistance level from previous days, BUT the RSI has also reached a dynamically calculated extreme deviati
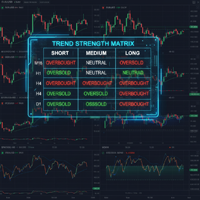
Tired of switching between charts? Trend Strength Matrix gives you an eagle-eye view of the market. This professional dashboard monitors the status of the Adaptive RSI across four key time frames (M15, H1, H4, D1) simultaneously.
What does this dashboard tell you? For each time frame, it calculates in real time: 1. The current RSI value. 2. The “Adaptive Status”: Is the market in an Overbought or Oversold zone based on historical volatility?
FEATURES: - Information at a glance: Instantly see
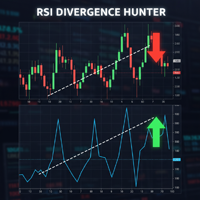
Divergences are one of the most powerful signals in technical analysis, but they are difficult to spot with the naked eye in real time. RSI Divergence Hunter automatically scans the market for these discrepancies between price and momentum.
What is a divergence? - Bullish: The price makes a lower low, but the RSI makes a higher low. (Buy signal). - Bearish: The price makes a higher high, but the RSI makes a lower high. (Sell signal).
FEATURES: - Automatic Detection: Intelligent algorithm that
# Product Name: SamuraiFX Momentum Hunter **Current Version:** 4.0 (Smart Validation Update) **Category:** Trend / Oscillators / Fractals **Timeframes:** M15, H1, H4, D1 (Recommended)
### ️ Trade with Discipline. Eliminate the Noise.
**SamuraiFX Momentum Hunter** is not just another arrow indicator. It is a complete trading system that combines the momentum of the **Awesome Oscillator (AO)** and **Accelerator Oscillator (AC)** with the structural precision of **Fractals**. Most indicators flo
Verion PowerSignal es un indicador diseñado para proporcionar señales visuales de posibles cambios en la dirección del precio, basado en un análisis interno de las condiciones del mercado que combina la dinámica de las velas y el comportamiento estructural. El propósito del indicador es ayudar al usuario a identificar áreas donde el precio puede mostrar cambios de impulso, agotamiento o continuidad dentro de una tendencia existente. Las señales se muestran directamente en el gráfico como flechas

Stop Guessing, Start Winning: Meet Swing Hunter Pro! Are you tired of confusing charts and late entries? The Swing Hunter Pro indicator is your ultimate weapon for capturing profitable market swings with unmatched clarity and confidence. This powerful tool combines the best of Hull Moving Averages (HMA) and Exponential Moving Averages (EMA) with a strict trend filter, giving you strong, high-probability signals right on your chart. Available in EA format. Link download https://www.mql5.com/en
FREE

Read carefully, because I’m about to sell my strategy based on over 11 years of study: This indicator plots multiple levels: thick and dotted, taking the ATR into account. On 90% of trading days, it touches one thick level and one dotted level. Levels are updated daily. If the price touches a thick level and a dotted level in a single day, trading for that day is over—you wait for the next day to look for the same setup. If the price comes very close to a level but doesn’t reach it, it’s likely
Shows Kaufman Efficiency Ratio value and smoothed by MA. Calculation is based on movement divided by volatility on a specified period. Levels are adjustable as well as visualization. Parameters: KERPeriod - period for ratio calculation. EMAPeriod - period for moving average. Shift - indicator shift. HigherLevel - low value of the higher zone. LowerLevel - high value of the lower zone. ShowHigherZone - allow higher zone drawing. HigherZoneColor - higher zone color. ShowLowerZone - allow lower zon
FREE

Stop Guessing, Start Sniping: Introducing SR Sniper! Tired of entry points that seem random? The SR Sniper indicator is your new essential tool for finding high-probability trades with surgical precision. It's designed to cut through the market noise, giving you clear Buy and Sell signals right at the most critical price zones. This powerful indicator combines the dynamic analysis of the Commodity Channel Index (CCI) with automatic Support and Resistance (S/R) detection —and then filters everyt
FREE

TouchGuard Alert – Advanced Price Alert & Notification Indicator for MetaTrader 4 (MT4) TouchGuard Alert is a fast, lightweight, and highly accurate price-touch Alert & Notification system designed for MetaTrader 4 (MT4) and MetaTrader 5 (MT5) . It automatically sends real-time Alerts, Pop-Up Alerts, Email Notifications, Push Notifications and early-warning notifications when price touches or approaches your chart objects. Key Features (High-Precision Alert & Notification System)

Stop Chasing Trends, Start Sniping Reversals: Introducing Stochastic Sniper Are you tired of trading sideways markets or getting caught by false breakouts? The Stochastic Sniper indicator is engineered for precision entry . It combines the volatility channels of Keltner Bands with the momentum timing of the Stochastic Oscillator to pinpoint extreme price reversals with high accuracy. Think of it as having a sniper scope on the market. It waits for the price to stretch to its maximum, confirm
FREE
Stop Guessing, Start Confirming: Introducing Signal Sentinel Are you tired of signals that leave you hanging? The Signal Sentinel indicator is your ultimate weapon against market uncertainty, designed to deliver high-probability trading setups directly to your chart. We've combined the power of two MACDs with a long-term EMA filter to ensure you only trade in the strongest, most confirmed trends. This isn't just another indicator; it's a complete confirmation system that acts as your guard a
FREE
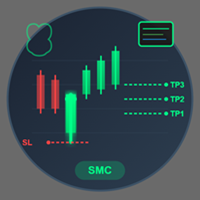
Only 5 copies $49 next price will be $89 Recommended Pair : XAUUSD, BTCUSD Recommended Timeframe : M15 Recommended Broker : ECN low or zero spread broker MT5 Version
The Smart Money SMC Breakout Indicator provides precise Buy/Sell breakout signals based on Smart Money Concepts. It automatically generates 3 Take-Profit levels and a Smart Stop-Loss level , helping traders manage entries and exits with clarity. The indicator includes a professional Statistics Panel with two selecta
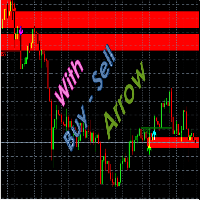
Indicator Guide: Key Price Levels & Structure Shifts 1. Description The indicator is a technical analysis tool for the Meta Trader 4 platform. It is designed to automatically identify specific price movements and to highlight corresponding price zones based on preceding price action. This provides a visualization of key price areas according to the indicator's internal logic. 2. Visual Elements & Their Identification The indicator identifies and draws several types of visual elements on the char

Trend tier-профессиональный индикатор визуализации каналов, разработанный для быстрого анализа дневной структуры цены и удобного мониторинга ключевых уровней. Индикатор автоматически определяет текущий максимум и минимум торгового дня по таймфрейму M5 и строит две отдельные проекции (High и Low), которые можно настраивать отдельно по процентному и фиксированному сдвигу. Каждая проекция формирует набор уровней (уровни вверх/вниз), опциональные P1-линии и рамки, а также «overlay» — чёрные

This is the MACD Confirmation Dashboard that allows users to find signal across all timeframes where signals agree. The Dashboard also provides ADR, AWR and AMR to allow its users to know range left for a pair. The AI Scoring System is currently in its early development and will continue to be updated. This Dashboard also has a Trade Executor that will Execute trades when signals are received however, this is a separate product and is in development and will begin sale as a compliment to the

This indicator identifies market structure breakouts using ZigZag-based swing points and confirmation blocks. When price breaks above a bullish block or below a bearish block, it generates a BUY/SELL signal and automatically draws Fibonacci levels for entry, stop-loss, and targets. Built-in alerts notify you instantly when a valid breakout forms, making it useful both as a stand-alone tool or as a powerful addition to any existing strategy.
Since this tool relies on ZigZag structure, some hist

# Product Name: Gold ATR Pro – Daily Breakout System
**Gold ATR Pro** is a specialized trend-following indicator designed exclusively for **XAUUSD (Gold)**. It eliminates market noise by identifying high-probability breakout zones based on the **Daily Opening Price** and **ATR (Average True Range)** volatility.
Unlike standard indicators that repaint, **Gold ATR Pro** provides fixed, reliable signals based on confirmed candle closes, ensuring that what you see on historical charts is exactly w

**Product Name:** Gold Seasonality Pro (Auto Fibonacci) **Headline:** Automate the "Smart Money" Seasonal Strategy for Gold (XAUUSD). **Overview** Stop guessing where Gold will reverse. History shows that **March** and **October** are the two most powerful months for institutional trend changes. **Gold Seasonality Pro** automatically scans for these key months, analyzes the buying or selling pressure, and draws the exact Fibonacci "Sweet Spot" levels for you. It turns 45 years of statistical dat

Symbols: USDCHF, USDJPY , XAUUSD, GBPUSD, EURUSD, AUDUSD, GBPJPY ( I Love USDCHF_H1 ) Timeframes: H1, H4, D1
Important features : No repaint, no lag, indirection signal, multi confirmation
Safety : signals contain stop loss , take profit and respect risk to reward rule
Includes: Free Multi-Time-Frame Scanner (After purchasing this product, simply send me a screenshot via private message and I will personally send you the Screener file.)
Full trading system concept : Read Article (full co

Smart Risk Manager Pro – Drag & Trade with Confidence
Smart Risk Manager Pro MT5: https://www.mql5.com/en/market/product/155713 Smart Risk Manager Pro is a professional on-chart risk management tool that calculates your position size based on your dollar risk. Simply click and drag on the chart and the indicator instantly shows: Direction (Buy / Sell) Distance in points Recommended Lot Size based on your RiskUSD value The tool is ultra-light, extremely fast, and designed for traders who want a
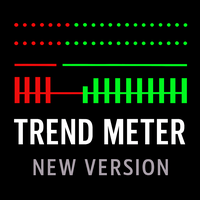
Trend Meter – Multicurrency Trend Power Analyzer The Trend Meter is a powerful and extremely lightweight indicator that shows you how strong the trend is at a glance — in real time, color-coded, clean and without delay. It analyzes multiple timeframes , multiple currency pairs , and multiple internal trend signals , combining everything into one compact “trend traffic light”. Perfect for scalpers, intraday traders and swing traders.
Perfect for beginners and professionals — the Trend Meter inst
About Range Explosion Range Explosion is a powerful and free trading tool designed to detect market ranges, draw precise support and resistance zones, and identify breakout opportunities with accuracy and style.
It is a part of the Break Out Explosion Project, offering traders a reliable and visually advanced solution for both beginners and professionals. MT5 Version of this product is available here : https://www.mql5.com/en/market/product/153004 If you are interested in breakout trading concep
FREE

Imagine: you are on the verge of huge profits, but the market suddenly changes and you miss the chance. Or even worse, you get losses instead of profits. What if you had a reliable ally who whispers in advance: "Get ready – the waves are coming!"? Meet Harbinger , a revolutionary indicator for MetaTrader 4, specially designed for traders who are tired of chaos and want to anticipate market changes! Harbinger is a smart algorithm that analyzes hidden trend volatility patterns to signal upcoming p
Product Title Smart Moving Average (MT4) – part of the SmartView series Short Description A new-generation Moving Average for MT4 with an on-chart Smart Control Panel, one-click visibility management, dynamic buffer value display on hover, and a modern inputs window; designed to work seamlessly with the full SmartView Indicators series. Overview Smart Moving Average focuses on user experience: a compact panel on the chart shows the key settings at a glance, lets you open the native inputs window
FREE

Dynamic FVG Detector – Fair Value Gap Indicator for MetaTrader 4 Dynamic FVG Detector automatically detects and displays Fair Value Gaps (FVG) on the chart. It identifies three-candle inefficiency patterns and updates zones in real time as they fill. Main Features Automatic detection of bullish and bearish FVGs Configurable pip threshold Minimum three-candle structure Immediate historical validation when a zone is created Dynamic Fill Tracking Continuous adjustment based on price interaction Zon

Everyone who purchases the Scalping signals M1 indicator receives a FREE BONUS — a fully automated Expert Advisor that trades based on the indicator’s signals.
The indicator shows the arrows — the robot can execute the trades for you, following all signals and risk-management rules. Scalping signals M1 – a ready-made trend-following entry system for M1 Scalping signals M1 is an indicator that turns your chart into a clear action map:
a colored trend channel shows the direction of the market, and
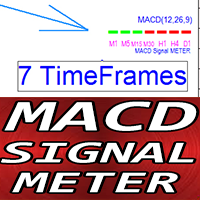
Crypto_Forex Indicator MACD Signal METER for MT4.
- Very useful MACD Signal METER indicator is showing current MACD value (above/below Signal line) for 7 timeframes simultaneously. - Green rectangle - MACD is above Signal line. - Red rectangle - MACD is below Signal line. - Forex Indicator MACD Signal METER can be used as trade entry filter for Multi Time Frame trading systems.
// Great Trading Robots and Indicators are available here: https://www.mql5.com/en/users/def1380/seller This is o
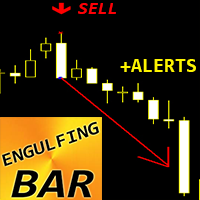
Crypto_Forex Indicator ENGULFING Bar Pattern for MT4, No repaint, No delay.
- Indicator "ENGULFING Bar" is very powerful indicator for Price Action trading. - Indicator detects Engulfing Bar patterns on chart: - Bullish Engulfing Bar - Blue arrow signal on chart (see pictures). - Bearish Engulfing Bar - Red arrow signal on chart (see pictures). - With PC, Mobile & Email alerts. - Indicator "ENGULFING Bar Pattern" is excellent to combine with Support/Resistance Levels.
// Great Trading Robots
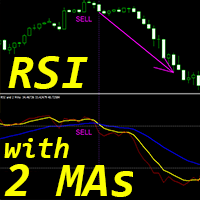
Crypto_Forex Indicator "RSI and 2 Moving Averages" for MT4, No Repaint.
- This indicator is excellent for momentum trading systems. - "RSI and 2 MAs" Indicator allows you to see Fast and Slow Moving Averages of RSI itself. - Indicator gives opportunities to see the trend change very early. - "RSI and 2 MAs" can be used to catch the momentum into the trend direction from OverBought/OverSold zones. - It is very easy to set up this indicator via parameters. - Indicator can be used on any timefram
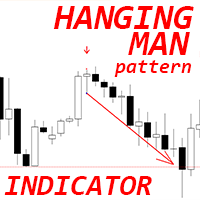
Crypto_Forex Indicator "Hanging Man pattern" for MT4, No repaint, No delay.
- Indicator "Hanging Man pattern" is very powerful indicator for Price Action trading. - Indicator detects bearish Hanging Man patterns on chart: Red arrow signal on chart (see pictures). - With PC, Mobile & Email alerts. - Indicator "Hanging Man pattern" is excellent to combine with Support/Resistance Levels.
// Great Trading Robots and Indicators are available here: https://www.mql5.com/en/users/def1380/seller Thi

MFCS (Multi Factor Channel Score) is an advanced indicator designed to provide a clear reading of market dynamics through a weighted scoring system and adaptive volatility-based channels. MAIN FEATURES: Adaptive ATR channels adjusted to real-time volatility Multi-factor scoring (position, volume, momentum, HTF trend, volatility) Signals categorized by score intensity (0–100) Complete dashboard showing score, trend, and key indicators Multi-timeframe filtering to align market direction Optional
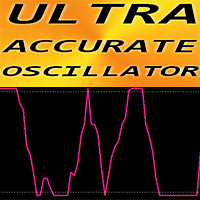
ULTRA ACCURATE Oscillator for MT4.
UA Oscillator - is an advanced custom Crypto_Forex indicator with around 80% accuracy when it is used in combination with trend indicator such as EMA for example.
- Advanced new calculation method is used. UA Oscillator is much faster and more accurate than standard MT4 oscillators. - New generation of Oscillators - see pictures to check examples of how to use it in combination with EMA10. - Oversold values: below 0.03 // Overbought values: over 0.97. - Ther
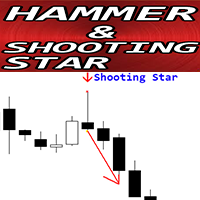
Crypto_Forex Indicator "Hammer and Shooting Star pattern" for MT4, No repaint, No delay.
- Indicator "Hammer and Shooting Star pattern" is very powerful indicator for Price Action trading. - Indicator detects bullish Hammer and bearish Shooting Star patterns on chart: - Bullish Hammer - Blue arrow signal on chart (see pictures). - Bearish Shooting Star - Red arrow signal on chart (see pictures). - With PC, Mobile & Email alerts. - Indicator "Hammer and Shooting Star pattern" is excellent to co
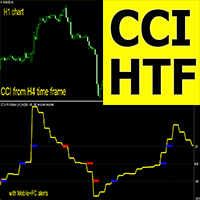
Crypto_Forex Indicator CCI HTF Oscillator for MT4.
- Upgrade your trading methods with the professional CCI HTF Oscillator for MT4. HTF means - Higher Time Frame. - Commodity Channel Index (CCI) measures the difference between the current price and the historical average price. - Important levels: +/-200, +/-100. - It is great to take Sell entries from above +200 zone and Buy entries from below -200 zone. - This indicator is excellent for Multi-Time Frame trading systems with Price Action entr
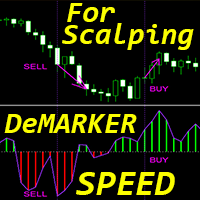
Crypto_Forex Indicator "DeMarker Speed" for MT4, No Repaint.
- The calculation of this indicator is based on equations from physics. DeMarker Speed is the 1st derivative of DeMarker itself. - DeMarker oscillator curve indicates the current price position relative to previous highs and lows during the indicator calculation period. - DeMarker Speed indicator is good for fast scalping entries (as you can see on pictures). - DeMarker Speed shows how fast DeMarker itself changes its direction - it
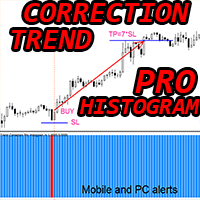
Crypto_Forex Indicator "Trend Correction Pro Histogram" for MT4, no repaint!
- Trend Correction Pro Histogram can be in 2 colors: red for bearish trend and blue for bullish one. - 7 consecutive histogram columns of the same color means beginning of new trend. - Trend Correction Pro Histogram indicator designed with the main purpose - to minimize losses and maximize profit. - It has parameter - "Period", responsible for indicator's sensitivity. - With Built-in Mobile and PC alerts. - Indicator
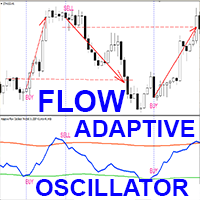
Advanced custom Crypto_Forex indicator "Adaptive Flow Oscillator" - efficient auxiliary trading tool for MT4!
- This indicator is a New generation of Oscillators. - "Adaptive Flow Oscillator" has adjustable adaptive Oversold/Overbought zones. - Indicator is using both price and volume data in calculations. - Oscillator is an auxiliary tool to find exact entry points from OverSold/OverBought areas. - Adaptive Oversold zone: below the Green line. - Adaptive Overbought zone: above Red line . - T
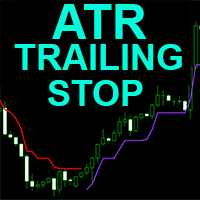
Crypto_Forex Indicator "ATR Trailing Stop" for MT4, No Repaint.
- Upgrade your trading methods with great auxiliary ATR Trailing Stop indicator for MT4. - This indicator is perfect for Trailing Stop purpose. - ATR Trailing Stop is automatically adaptive to market volatility. - No delays and easy set up. - This indicator is excellent to combine with price action entries into the direction of main trend.
// Great Trading Robots and Indicators are available here: https://www.mql5.com/en/users/
Product Title Smart Moving Average PRO (MT4) – part of the SmartView series Short Description Professional advanced edition of Smart Moving Average with 12 custom MA types, smart alert system, two-color trend line, and integrated SmartView control panel on chart. Combines professional power and high performance with ease of use and smart interface. Overview Smart Moving Average PRO is a comprehensive upgrade from the free version, providing 8 additional advanced moving average types (HMA, KAMA,
Williams Fractal Trailing Stop is a professional trading tool that combines the principles of Bill Williams fractal analysis with an adaptive trailing stop mechanism. The indicator provides an accurate definition of the moments for entering a trade and minimizing market risks.
The system automatically identifies fractal structures on the chart and calculates optimal levels for moving a stop order. This allows you to protect profits and limit losses.
The indicator continuously analyzes marke

Does this sound familiar? You enter based on an arrow signal, only for the price to immediately reverse and hit your stop loss... You enter on a baseless gut feeling like, "It looks like it's about to go up," only to end up with a floating loss (a classic case of overtrading)... You can see a clear trend is forming, but you don't know where to get in, and you're stuck watching the perfect opportunity slip by... You repeatedly buy at the top and sell at the bottom, watching your capital slowly dw

BBRSI Quantum (Free Edition) BBRSI Quantum is a powerful, 100% Non-Repainting indicator for MetaTrader 4 that generates clear Buy and Sell arrows based on an advanced momentum strategy. This tool is designed for traders who want to identify precise entry points during overbought or oversold conditions. This is the fully functional FREE edition. The Core Strategy: Bollinger Bands on RSI Unlike standard indicators, BBRSI Quantum does not apply Bollinger Bands to the price. Instead, it applies th
FREE
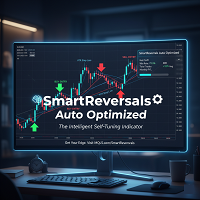
SmartReversals Auto Optimized: The Intelligent Indicator That Adapts to Your Chart Tired of indicators with fixed settings that only work in one market? Frustrated by endless manual optimization with no results? Introducing SmartReversals Auto Optimized – the first indicator that automatically optimizes itself for your chart. The real magic is its built-in Auto-Optimization Engine . Revolutionary Feature: Smart Auto-Optimization No more manual backtesting or guessing parameters! Whe
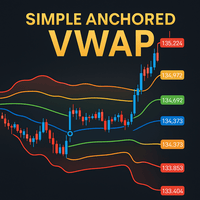
Simple Anchored VWAP is a lightweight yet powerful tool designed for traders who want precise volume-weighted levels without complexity.
This indicator lets you anchor VWAP from any point on the chart and instantly see how price reacts around institutional volume zones. MT5 Version - https://www.mql5.com/en/market/product/155321/
Join To Learn Market Depth - https://www.mql5.com/en/channels/suvashishfx Using VWAP bands and dynamic levels, the tool helps you understand where real buying and s
FREE

Acceleration Bias — Price Acceleration Impulse Indicator Acceleration Bias is a modern analytical tool designed to measure changes in price acceleration and visualize impulse asymmetry using a robust mathematical model.
This indicator is intended for traders working with market volatility, impulse phases, and price-movement structure, as well as those who need algorithmic, rule-based analytical support. Purpose and Core Concept Unlike traditional oscillators that analyze only velocity changes
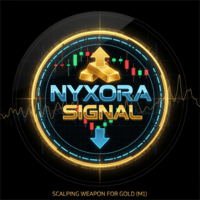
NYXORA SIGNAL – Precision Scalping Power for XAUUSD (M1) NYXORA SIGNAL is an advanced scalping indicator designed exclusively for XAUUSD (Gold) on the M1 timeframe .
It automatically detects potential reversal zones and refines them into a precise 30-pip area , giving traders fast and accurate entries in the ultra-volatile Gold market. Main Features Auto Reversal Zone Detection – Smart algorithm that identifies and refines potential reversal areas into a consistent 30-pip zone. Custom SL & TP Le
FREE

OB Scanner Indicator — Overview OB Scanner is an enhanced Support & Resistance + Supply & Demand indicator designed to help traders identify where institutions and smart money are placing orders. It scans the chart for: 1. Order Blocks (Improved Demand & Supply Zones) Automatically detects Bullish Order Blocks (Demand) Automatically detects Bearish Order Blocks (Supply) Marks high-probability reversal zones Filters out weak OBs with volume and break-of-structure (BOS) confirmation 2. Buyer
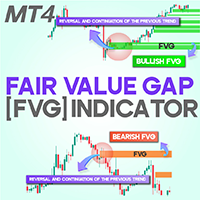
Fair Value Gap (FVG) Indicator for MetaTrader 4 In the world of trading, identifying price imbalances and high-probability trade setups is essential. The Fair Value Gap (FVG) indicator for MetaTrader 4 is a powerful tool that helps traders spot such opportunities with precision. An FVG represents a market gap that occurs when price moves sharply, leaving an area where supply and demand are out of equilibrium. Simply put, when three consecutive candlesticks form, the space between the first and
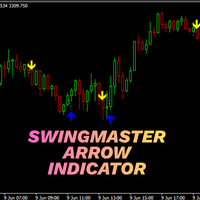
SwingMaster Arrow Indicator – Don’t Let the Big Move Leave You Behind Do you close your charts… and then watch price explode exactly where you were looking?
SwingMaster Arrow Indicator is built to solve that frustration – it pinpoints clean swing entries and exits so you can focus on the real move and ignore the market noise. This is not a random arrow generator.
SwingMaster uses a smart, SuperTrend-style swing engine that tracks price structure and volatility, then marks high-probability turnin

JED-Trend Enhanced v5.9 — Elite Non-Repainting Trend Filter
JED-Trend Enhanced v5.9 is a professional trend-following indicator based on a three-dimensional analysis of market dynamics: - Jerk — the third derivative of price (acceleration of acceleration) detects emerging momentum - Shannon Entropy — measures market orderliness and filters out chaotic noise - SMA-Based Phase Analysis — structures the market into bullish, bearish, and flat phases
Key Features
Phase-Based Filteri
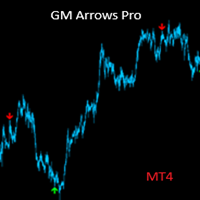
Product Name: GM Arrows Pro – Signals & Alerts Short Description:
GM Arrows Pro is a clean, reliable MT4 indicator showing BUY/SELL arrows on the chart with unique alerts at the moment the signal appears. Full Description:
GM Arrows Pro is a professional MT4 indicator designed for traders who want clear, actionable signals: BUY and SELL arrows visible on the entire chart history Unique alerts when a new signal appears (no repeated alerts) Option to disable repetitive signals ( disable_repeatin
Cycle Signals Indicator. Gives signal on price range cycling and smoothed with algorithm. There are very small parameters: allow alerts (Pop Up or Email), colors for chart arrows, timeframe to use for calculation (but better to use current timeframe). And most important parameter is "period". For low timeframes high values are recommended. Current period is good for M5. Decrease it for higher timeframes. Close trade arrows will come soon. MT5 version comes soon (but with some small price).
FREE
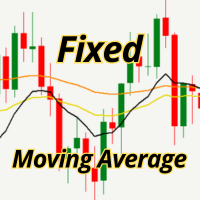
Display any moving average in its original timeframe, regardless of the chart’s timeframe.
What does it do?
This indicator allows you to view a moving average from any timeframe (M5, H1, H4, D1, etc.) directly on your current chart, preserving its original values from the timeframe you selected.
Practical example:
You are trading on the M5 timeframe.
You activate the H1 MA with this indicator.
You see exactly the same line you would see if you switched to H1.
Without changing the timeframe
Chara
FREE

The Sessions Partition Indicator draws clear, accurate session separators for the Sydney, Tokyo, London, and New York trading sessions.
It automatically adapts to your broker’s server time and allows full GMT customization. Designed especially for IC Markets (Winter – GMT+2) , this indicator gives traders a clean visual structure of the market’s intraday phases – making session-based strategies MUCH easier to follow. Key Features 4 Major Forex Sessions Marked Sydney Session Tokyo Session Lon
FREE
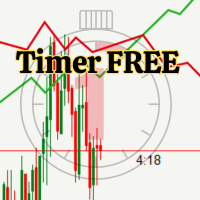
Countdown timer for candle close.
FUNCTIONS:
- Exact countdown to candle close
- It works on all timeframes (M1 to MN)
- 2 display formats
- Customizable font color and size
- Adjustable position on the chart
- Real-time update every second
IDEAL FOR:
- Scalping and day trading
- Trading with precise timing
- Practice time management in operations
- All traders who need timing control
Do you want more?
Upgrade to Timer PRO and get:
- Real-time Profit/Loss display
FREE
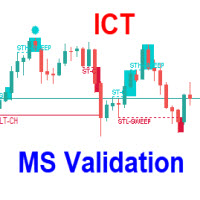
The ICT Anchored Market Structures with Validation trading indicator is designed to bring precision, objectivity, and automation to price action analysis. It helps traders visualize real-time market structure shifts, trend confirmations, and liquidity sweeps across short, intermediate, and long-term market phases — all anchored directly to price, without relying on any external or user-defined inputs. Uses Market structure is one of the most critical foundations of price action trading st

Reversing MACD — Indicator Overview Reversing MACD is a forward-looking analytical tool that calculates the exact price the next bar would need to reach for the MACD line and the signal line to cross on the upcoming candle .
Instead of waiting for a crossover to occur after the fact, the indicator answers a more powerful question: “At what price will the MACD cross on the very next bar ?” Core Idea Behind the Indicator Traditional MACD reacts to price changes after they occur .
A trader only see

ICT Kill Zone Indicator - Smart Trading Session Visualization Tool Product Highlights: Precise, Beautiful, Intelligent Trading Session Identification Why You Need This Indicator? Dear Trader, have you ever missed perfect trading opportunities because you couldn't identify key market sessions? Have you struggled with timezone confusion when analyzing market rhythms? The ICT Kill Zone Indicator is the perfect solution to these challenges! Developed based on core ICT trading concepts, this
Learn how to purchase a trading robot from the MetaTrader Market, the store of application for the MetaTrader platform.
The MQL5.community Payment System supports transactions via PayPal, bank cards and popular payment systems. We strongly recommend that you test the trading robot before buying, for a better customer experience.
You are missing trading opportunities:
- Free trading apps
- Over 8,000 signals for copying
- Economic news for exploring financial markets
Registration
Log in
If you do not have an account, please register
Allow the use of cookies to log in to the MQL5.com website.
Please enable the necessary setting in your browser, otherwise you will not be able to log in.