Watch the Market tutorial videos on YouTube
How to buy а trading robot or an indicator
Run your EA on
virtual hosting
virtual hosting
Test аn indicator/trading robot before buying
Want to earn in the Market?
How to present a product for a sell-through
New Technical Indicators for MetaTrader 4 - 11

FVG - Fair Value Gap The FVG - Fair Value Gap is an advanced MQL4 indicator designed for traders who utilize institutional order flow and Smart Money Concepts to identify market inefficiencies. This indicator automatically detects and highlights Fair Value Gaps (FVGs) on your chart, providing a clear visual representation of potential support and resistance zones, reversal points, and high-probability trading setups. Key Features: Automated FVG Detection: The indicator automatically identifies
Stop missing powerful breakout opportunities! The Advanced Breakout Scanner Dashboard is a professional-grade trading tool that monitors up to 28 currency pairs in real-time, scanning for ten unique high-probability breakout strategies simultaneously. Attach it to a single chart to get a complete overview of the entire market, instantly identifying the best trading setups as they happen. This is not just a signal indicator; it's a complete trading dashboard designed for serious breakout traders.
Major FX Signal Panel ( AI Trade Planner's) - Professional Intraday Signal Dashboard Unlock Your Intraday Trading Potential with a Powerful, All-in-One Signal Dashboard. Are you tired of switching between charts and struggling to find high-probability intraday setups? This Panel is a professional-grade MetaTrader 4 indicator designed to give you a decisive edge. It scans seven major currency pairs in real-time and delivers a complete, data-driven trade plan directly on your chart. Stop guessin

This is a custom MT4 indicator called “Elsna Moving Average” . It plots three moving averages (MA1, MA2) on the chart with customizable periods, shifts, methods, and applied prices. MA1 & MA2 can optionally be used to create fill areas (histogram-like shading) based on a color-fill setting You can show or hide each MA individually. The indicator is designed for trend identification and visualization , helping traders see MA relationships and potential support/resistance zon
FREE

All-in-one pivots + trend + smart alerts. PivotTrend Sentinel reveals key decision levels across multiple periods while staying context-aware with a clean, non-intrusive UI. It combines Daily history pivots, Weekly/Monthly structure, and now Quarterly / Semi-Annual / Annual (Q/H/Y) levels—plus a flexible trend filter and one-shot notifications (touch & trend change). Built for clarity and speed on any symbol/timeframe. Who it’s for Beginners, professional traders, and institutions (including ba
PipsZenith Volatility Breakout Indicator – Product Description Overview The PipsZenith Volatility Breakout Indicator is a professional MT4 tool designed for traders who want to identify high-probability breakout zones based on volatility and recent price action . With clear visual signals, adjustable display, and safe alerts, this indicator helps you stay ahead of market moves , maximize trading opportunities, and trade with confidence. Key Features Breakout Levels Based on Volatility Automatica
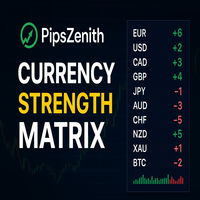
PipsZenith — Currency Strength Matrix & Volatility The PipsZenith Currency Strength Matrix & Volatility Indicator is a powerful and easy-to-use tool designed to transform the way you trade. Whether you're a beginner or an experienced trader, this indicator gives you clear and actionable insights into which currencies are strong, which are weak, and where the best trading opportunities are. With this tool, you’ll always know what to trade and in which direction , so you can make smarter, faster,
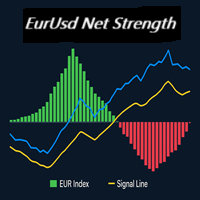
EURUSD Net Strength is a custom indicator designed to provide a clear view of the relative balance between Euro and U.S. Dollar pressure in the market.
Instead of analyzing a single chart in isolation, it evaluates a basket of major EUR and USD currency pairs, applies weighted importance based on liquidity, and translates the combined result into a color-coded histogram.
Green bars indicate periods when Euro demand outweighs Dollar strength, while red bars highlight when the Dollar dominates.

OrionFX AI Market Scanner - Your Ultimate Signal Dashboard Stop switching between dozens of charts. See the entire forex market from a single, professional interface. OrionFX is a professional-grade market scanner that combines a powerful 24-instrument dashboard with a high-confluence, five-indicator signal strategy. Designed for traders who demand precision and clarity, this indicator scans the market in real-time, identifying the highest-probability trade setups where all strategic components

Smart Signal Generation - Trend-Following Pro Dashboard - Multi-Currency Trading Indicator Overview The Trend-Following Pro Dashboard is a comprehensive multi-strategy trading indicator designed for serious Forex traders who demand professional-grade analysis across 28 major currency pairs and gold. This all-in-one dashboard combines the most effective trend-following strategies into a single, visually stunning interface that provides clear trading signals, precise entry points, and calculat
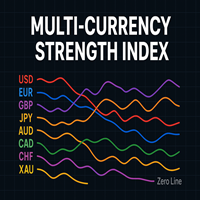
The Multi-Currency Strength Index is a powerful market analysis tool designed to measure and visualize the relative strength of major world currencies and gold (XAU) within a single chart window. Unlike traditional indicators that focus only on a single symbol, this indicator evaluates strength across a carefully selected set of currency pairs, providing traders with a broad and dynamic perspective of capital flow between currencies. It covers eight assets : USD (Red) EUR (Blue) GBP (Purple) JPY

Reversal Merchant Overview Reversal Merchant is a non-repainting MT5 indicator that identifies high-probability market turning points. It combines Average True Range (ATR) volatility analysis with a long-term 100-period EMA filter to catch exhaustion moves and potential reversals. The tool draws clear buy/sell arrows directly on the chart and can optionally alert you in real time.
Core Logic
Look-Back Reversal Detection: Scans the highest highs and lowest lows over a user-defined period to loc

PipsZenith Momentum Box – Complete Details Indicator Name: PipsZenith Momentum Box Version: 1.0 Platform: MetaTrader 4 (MT4) – ATR-based momentum detection Product Overview: The PipsZenith Momentum Box is a professional ATR-based momentum indicator designed to detect high-probability price moves in real time. It identifies strong momentum candles, highlights them visually with dynamic boxes, and projects potential Take Profit (TP) and Stop Loss (SL) levels to give traders a clear roadmap for

Momentum Scan Pro - The Ultimate Multi-Timeframe Signal Dashboard Stop switching between charts and timeframes. Momentum Scan Pro is a powerful, all-in-one dashboard that scans the entire market for high-probability momentum signals, delivering everything you need to trade with confidence in a single, clean interface. Built for traders who value speed and efficiency, this indicator scans up to 28 instruments across 5 different timeframes simultaneously. It identifies powerful trend continuation
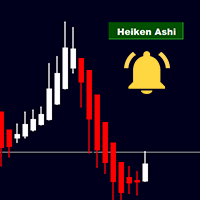
This is a Heiken Ashi indicator with an button adjustable button and alarm options. See more details below:
FEATURES OF THE INDICATOR: It's plug and play. Just drop it on any chart, and you are good to go. It doesn't interfere with any other indicators that are already on the chart. You click the button it shows, you click again and it disappears. You can change the The Heiken Ashi candle width by clicking on the scale button of Metatrader. Or you can preset it to whatever thickness you like.

RegLin Polinómico – Polynomial Regression Bands with Intelligent Filters RegLin Polinómico is a professional indicator that fits a polynomial (degree 1 , 2 , or 3 ) over a rolling price window and builds dynamic bands from the standard deviation of the fit’s residuals . It includes RSI (with selectable timeframe) and a trend-only option to filter out low-quality breakouts. You can also enable/disable sound when visual signals (arrows) are generated. How it works Fits a configurable-degree polyno
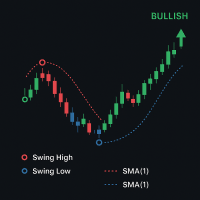
HighLow Swing — Trend & Swing Detection Indicator Description:
HighLow Swing is a powerful trend and swing detection indicator designed to help traders easily identify key market turning points and trend directions on any chart timeframe. It highlights significant swing highs and lows, draws trend circles based on swing structure, and helps you stay ahead of the market momentum with clear visual signals. Key Features: Swing Point Detection: Automatically detects and marks important swing hig

Lot Size Calculator – Position Sizing Tool This indicator calculates lot size based on the selected risk percentage and stop loss distance. It is designed for Forex & Gold and cryptocurrency trading.
Main Features Position sizing based on account balance / available equity and chosen risk percentage Market order and pending order modes Visual trade levels: entry, stop loss, and take profit lines on chart Risk-to-reward ratio display Automatic lot adjustment depending on stop loss distance Prof
Volume Decomposition Index (VDI) VDI is a proprietary volume analysis indicator designed to identify the strength and direction of price movement based on the decomposition of volume into buying and selling activity. The indicator visualizes the ratio between buys and sells by projecting candlestick price data onto its volume, allowing traders to gain a more comprehensive view of market dynamics — namely, how much volume was driven by buyers and how much by sellers. Calculations are based on al
FREE

Other profitable programs https://www.mql5.com/en/users/ifyjava/seller The Solarwind No Repaint is a technical oscillator that applies the Fisher Transform to normalized price data, creating a histogram-based indicator that identifies potential market turning points. This indicator converts price movements into a Gaussian normal distribution, making cyclical patterns and momentum shifts more visible to traders. How It Works The indicator processes price data through several computational step
FREE
Pearson Indicator Correlator is a custom statistical indicator that calculates the Pearson correlation coefficient between the Exponential Moving Average (EMA) and any other selected indicator — standard or custom. The indicator helps to filter out false signals, identify movement consistency, and detect divergences between the trend and signal lines. Used for: filtering signals from other indicators, analyzing movement consistency, detecting divergences between the trend and signal lines. It o

The TMA AI Bands indicator is based on the Triangular Moving Average (TMA) with dynamic upper and lower bands and clear buy/sell arrows plotted directly on the chart. It features integrated AI for adaptive optimization and guarantees no repaint, providing precise reversal signals when price touches the bands. Pairs: works with all currency pairs Recommended timeframes: D1 / W1 / MN Configurable external variables: TimeFrame – calculation period HalfLength – smoothing of the average BandsDeviatio

Scalping Strategy Trend detection is one of the basic challenges of every trader. Finding a way to tell when to enter a trade is very important, timing is a game changer, not too early and not too late. Sometimes, due to not knowing the market conditions, the trader closes his positions with a small profit or allows the losses to grow, these are the mistakes that novice traders make. Indicator Trend Whipper is a complete trading strategy and can improve the trader's trading process. The trend de
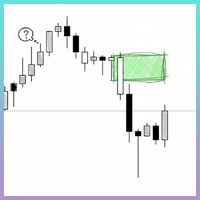
This indicator incorporates built-in volume statistics, identifying true liquidity zones based on real-time trading volume and comparing it to the volume of the last 500 candlesticks. Based on the identified results, liquidity zones are plotted on the chart, indicating potential price swings. We typically identify key liquidity zones that have not yet been breached in larger timeframes, then look for suitable entry opportunities in smaller timeframes. When the price touches a key liquidity zone

Indicator Overview The Final Gold Cup is a complete trading system designed to simplify technical analysis. It combines the most powerful trading tools into one user-friendly package, giving you a crystal-clear view of price action and helping you make informed trading decisions. The indicator works efficiently across all assets and timeframes. [ Illustrative Image of the Indicator on the Chart ] Key Features Dynamic Support & Resistance Zones: Automatically plots the most significant support a
OneShotFX is a scalping arrow signals type indicator, an all in one arrow system with money management and filtered signals. How to trade Buy : when up arrow prints on the chart open buy trade, set your tp and sl on colored tp and sl lines above and below the arrow signal candle. Sell: when up arrow prints on the chart open sell trade, set your tp and sl on colored tp and sl lines above and below the arrow signal candle. Why is it a good choice Plenty of signals : no need to wait for long per
FREE
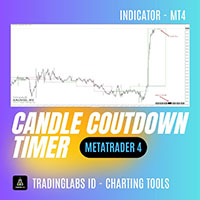
Candle Timer Countdown (CTC) – Minimalist & Precise Candle Timer Candle Timer Countdown (CTC) is a lightweight and non-intrusive MetaTrader indicator that displays the remaining time of the current candlestick on your chart. Designed with simplicity and clarity in mind, this tool helps traders stay aware of candle closures without cluttering the chart. Key Features: Real-Time Candle Countdown
Always know how many seconds are left before the current candle closes – works on all timeframes. Minima
FREE
Dual Momentum is a modern arrow indicator for MetaTrader 4, created specifically for the accurate detection of market reversals and strong impulse movements.
The indicator is based on a combination of two powerful oscillators – Williams %R and RSI, which allows you to filter noise and generate more reliable signals. Thanks to this, Dual Momentum indicates only key entry points when the probability of a successful trade is highest.
Key advantages:
No redrawing – signals remain on the cha
Support & Resistance Hunter MT4 Support & Resistance Hunter MT4 automatically builds key support and resistance zones based on the Parabolic SAR. The indicator detects breakouts, flips (role reversal of a level), and locks frozen zones after a double breakout. Suitable for chart analysis on any timeframe and instrument. Settings General LookbackBars (0) — number of bars to analyze. 0 = full history. MaxZones (0) — maximum number of zones to display. 0 = all zones. ExtendBars (0) — numb
The Final Neutral Bottom indicator by saqr studio is a powerful technical analysis tool designed for MetaTrader 4 (MT4). It meticulously analyzes price action within a recent range to identify strong momentum shifts, providing clear, actionable trading signals with pre-calculated risk management zones. Core Features Momentum Analysis Box: The indicator automatically draws a box around a user-defined number of recent candles to establish the current trading range (high and low). Clear Buy/Sell S
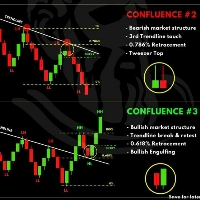
TRADING FLOW WITH AUTO TREND LINE FREE 1. Identify Market Structure Automatically Watch for key price action structures: BOS (Break of Structure) CHoCH (Change of Character) EQH / EQL (Equal High / Low)
These help you understand the current market phase (reversal or continuation) based on Smart Money Concept. 2. Use Auto Trend Line Trendlines are automatically drawn based on valid structure. Breakout of a trendline → potential trend change Rejection from a trendline → possib
FREE

as the name suggest Trend Maker Master is a trend scalping indicator that give long and short trading opportunity based on price action and ma style trend filter, the indicator Trend Period and Trend Extra Filter will change arrows signals quality and frequency, this leave a space for trader to come out with good combos for each pair. How to trade : Buy : when white buy arrow prints, set sl below recent swing low, and set tp to 1-1 Risk to reward ratio. Sell : when white Sell arrow prints, set
FREE

TRADING FLOW USING AUTO FIBO MUSANG + ALERT SIGNAL 1. Wait for Breakout Alert (Auto Signal) The Auto Fibo Musang system will automatically trigger an alert when a potential breakout is detected from previous price structure.
This serves as the early signal that the market may be ready to move. 2. Identify the Entry Zone (Auto Fibo Levels) The entry zones are auto-plotted based on Fibonacci Musang levels :
Buy Zone (blue levels), Sell Zone (red levels).
No need to draw manu
FREE
LINK : https://linktr.ee/ARFXTools ;
BBMA + SMC TRADING FLOW (Smart & Simple) 1. IDENTIFY THE MAIN TREND (Multi Time Frame) Use indicators: BBMA MTF PANEL (check trend direction on MN, W1, D1, H4) Only trade when D1 and H4 are in the same direction Example :
If D1 = Buy and H4 = Buy → Focus on Reentry Buy only 2. WAIT FOR CSA + CSM (Valid Entry Setup) CSA Buy : Candle closes outside lower Bollinger Band + MA5 low > MA10 low CSM Buy : Candle re-enters BB + MA5 low crosses above MA10
FREE

Stochastic with Trend Filter: Precision Signals This is a powerful and easy-to-use indicator designed for traders who want more reliable signals from the classic Stochastic oscillator. How It Works: This indicator improves on the standard Stochastic by adding a powerful trend filter. It uses an Exponential Moving Average (EMA) to determine the overall direction of the market. The indicator will only generate a "buy" signal when both the Stochastic crossover is bullish and the price is above the
FREE
Multi-TimeFrame Divergence Pro — Quick Start Guide
Thank you for purchasing Multi-TimeFrame Divergence Pro — a powerful, non-repainting divergence scanner designed for precision traders. This guide will help you set up and use the indicator effectively without overwhelming you with technical details.
️ Installation & Setup Apply to Chart
Drag and drop the indicator onto any MT4 chart (any symbol, any timeframe). Basic Settings (Inputs Tab)
Adjust these to match your trading style: Enable

Simple Candlestick Timer – Free MT4 Indicator Simple Candlestick Timer is a lightweight and easy-to-use MT4 indicator that displays a precise countdown until the current candlestick closes. This tool helps traders improve timing, discipline, and decision-making by showing exactly how much time remains before the next candle begins. Key Features: Clean countdown display directly on your chart. Helps with entry and exit timing. Lightweight, simple, and beginner-friendly. Works on all symbols and t
FREE
Altopium Trend is an indicator that identifies short-term trends. The signals it generates can be used to open long or short positions or can be integrated with other indicators/strategies. This is a trend indicator, be careful during narrow sideways phases. I recommend using it as a short-term trend indicator, complemented by other indicators that show the best times to enter the market.
Wait for the bar to close to confirm the signal.
FREE
First SMC based (working) buy sell signal indicator
Indicator will only draw NEW signals, To back test, use strategy tester. MESSAGE me for BONUS.
This indicator is one of my best development. I struggled with implementing my method for a long time but finally i was able to automate my entries. We are still not there yet as my exists and sl's are dynamic. as soon as i figure dynamic sls and exists implementation, I will push the update. I might increase the cost exponentially. This indicator

Trading Flow Using the Engulfing Gator Multi Trend Filter 1. Monitor Multi-Timeframe Trend (MTF Filter) Use the Multi-Timeframe Trend Scanner to check the overall market direction across at least 2 out of 3 timeframes (e.g., H1, H4, D1).
If the majority show the same trend direction (e.g., all are in an uptrend ), that’s your initial trend confirmation . 2. Identify Trend Line Breakout or Rejection Use the Auto Trend Line feature to detect: Breakouts from triangle, wedge, or cha

Clear Simple Direction – Trend Following Indicator for MT4 Clear Simple Direction is a lightweight yet powerful trend-following indicator designed to give traders clarity in uncertain markets. Built with simplicity in mind, it removes unnecessary noise and focuses only on what truly matters: the trend direction. Whether you are a beginner or an experienced trader, this indicator helps you stay aligned with the market flow, reducing hesitation and improving discipline. Key Features: Clear Signal
Fusion Signal — ATR HiLo Channel SMP TT (Multi-Timeframe Indicator) Fusion Signal is an advanced MT4 indicator that blends ATR-based volatility channels with smoothed moving averages and configurable signal arrows. It’s designed to help traders identify trend direction, dynamic support/resistance and actionable breakout/reversal points with multi-timeframe precision. The indicator is highly configurable and suitable for a broad range of instruments (FX, metals, indices) and trading styles (swing
FREE

Range Filter - BreakOut EA
What is the Range Filter? The Range Filter is an innovative tool designed to smooth out market noise and highlight meaningful price movements. Rather than focusing on every small fluctuation, the Range Filter eliminates insignificant activity, allowing traders to see trends more clearly. The idea comes from the QQE’s volatility filter, but instead of applying it to RSI, this approach is applied directly to price action. Here’s how it works: A smoothed average of t
FREE

Spread Sekanas: The True Cost of Your Trade Stop guessing with pips and points. Start seeing the real , proportional cost of the spread with the Spread Sekanas indicator. The traditional spread, measured in pips, is misleading. A 2-pip spread on EUR/USD is completely different from a 2-pip spread on GBP/JPY or a $2 spread on Gold. This makes it impossible to consistently compare your real trading costs across different instruments. The Spread Sekanas indicator solves this problem by measuring th
FREE
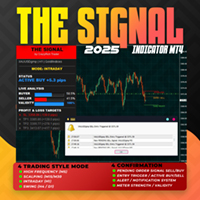
Overview The Signal Premium System for All Pairs is a smart trading assistant designed for Forex, Gold (XAUUSD), and Indices.
It automatically adapts to any timeframe and provides clear entry, Stop Loss, and Take Profit levels to support consistent and confident trading. This indicator helps traders identify high-probability setups across multiple markets and trading styles — whether you prefer scalping, intraday, or swing trading. Core Features 1. Smart Signal Status Waiting for Signal:
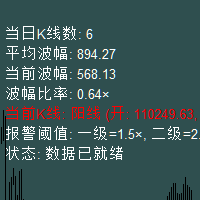
波幅报警指标功能介绍 一、核心功能:实时监测价格波动异常 波幅报警指标是一款适用于 MT4 交易平台的工具,核心功能是 实时追踪金融品种(如外汇、股票、期货)的价格波动幅度 ,通过对比当前 K 线波幅与当日平均波幅,识别异常波动并及时提醒交易者,帮助捕捉潜在交易机会或风险。 二、核心特性详解 1. 精准波幅计算 实时波幅监测 :自动计算当前 K 线的价格波动幅度(最高价 - 最低价)。 平均波幅统计 :动态统计当日所有 K 线的波幅,计算平均值作为基准。 波幅比率分析 :通过 “当前波幅 ÷ 平均波幅” 得出比率,直观反映波动强度。 2. 三级分级报警机制 根据波幅比率与预设阈值的对比,触发不同级别的报警,避免过度干扰同时确保关键信号不遗漏:
一级报警 :当波幅比率超过 1.5 倍平均波幅时触发,默认仅弹窗提醒(可自定义)。 二级报警 :当波幅比率超过 2.0 倍平均波幅时触发,默认弹窗 + 邮件提醒(可自定义)。 三级报警 :当波幅比率超过 3.0 倍平均波幅时触发,默认弹窗 + 邮件 + 声音提醒(可自定义)。
智能冷却机制 :每个级别可设置冷却时间(如一级 300 秒、二级

The TraderProfit7TopDown is a sophisticated multi-confirmation technical indicator for MetaTrader 4, designed to generate high-probability trading signals by synthesizing data from price action, momentum, and market volume. Its core philosophy is to filter out market noise and false breakouts by requiring a confluence of four distinct analytical factors before presenting a signal, making it a robust tool for trend-following strategies.
The indicator's logic is built upon a layered approach. F

CCI 4-Color Trendline Indicator
The CCI 4-Color Trendline is a unique forex indicator that combines the power of the Commodity Channel Index (CCI) with the flexibility of a moving average . It delivers clear, color-coded signals to guide your trading decisions with confidence.
How It Works
Green Line → Buy Signal
Dark Green Line → Buy Signal is getting strong
Red Line → Sell Signal
Dark Red Line → Sell Signal is getting strong
Orange or White Line → Neutral (no trade signal)

DFX InteliTrade
Shark PRO v6 Special Edition
User Manual & Comprehensive Guide
1. Indicator Overview Product Name: DFX InteliTrade Shark PRO v6
Developer: Dr. Hassane Dabai (Finance Engineer) ,dr.dabai@gmail.com |+(966)59-730-4266
Latest Version: v6 (September 2025)
Platform: MetaTrader 4 (MT4) 2. Brief History & Philosophy The DFX InteliTrade Shark PRO is the culmination of 16 years of research and development (since 2009). It evolved from a basic trend-following system into a sophistica
What is SipperTrendGuard? SipperTrendGuard is a precision histogram that does one job — and does it bloody well:
It keeps you out of the weak zones and highlights only the clean, directional movements worth trading. Built using EMA slope differentials , normalized by ATR , and scaled symmetrically around zero , this tool gives you a crystal-clear view of real market pressure — up or down. No guesswork. No "maybe" zones. Weak candles?
They get boxed in big pale blocks like a quarantine zone.
Stro

-The One Minute Gold is a volume-price action-trend filtered entry arrow signals that help traders take the right side of the market and generates opportunities. CONTACT IN PRIVATE FOR EA VESION. ( POWERFUL PERFORMANCE ARROWS HERE <) Why Chose the One Minute Gold ? 1. TP-SL . With a built-in tp and sl objects that come on chart for each signal so the trader can place tp and sl accordingly, the tp and sl logic has two methods : ATR Tp and Sl - Fixed points Tp-Sl. 2.STATS PANEL … An informative pa
FREE

LinearRegressionBands – Intelligent signals with Regression Channels + RSI Turn market reading into a clear, visual decision. LinearRegressionBands draws a linear regression line over the recent price window and generates dynamic channels (± standard deviations) to identify extremes. Entry arrows appear only when there is a genuine band breakout accompanied by an extreme RSI confirmation; optionally, you can require the regression slope to align with the signal (trend-only mode). What does it so
The Pulse is an indicator that shows the accumulation period in real time. In simple words: Accumulation is when "smart money" quietly collects an asset before launching a powerful movement in the market. On the chart, it looks like the price is "stuck" in one range. This is the accumulation phase — someone is preparing for a big move. And if you learn to notice these moments — when the market seems to "freeze", but at the same time tension is felt — you can be in the right place at the right t
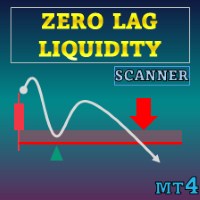
Special offer : ALL TOOLS , just $35 each! New tools will be $30 for the first week or the first 3 purchases ! Trading Tools Channel on MQL5 : Join my MQL5 channel to update the latest news from me Zero Lag Liquidity plots liquidity zones from lower-timeframe wick profiles and high-volume wicks. For each abnormal candle, the indicator builds an intra-wick volume histogram, finds a local Point of Control (POC), and renders that price as a level. Subsequent interactions can trigger l

The Donchian Breakout Scanner Pro is a comprehensive multi-symbol monitoring tool that automatically tracks Donchian channel breakouts across various trading instruments and timeframes. This advanced scanner continuously analyzes price action using the classic Donchian channel methodology , identifying significant breakout patterns as they develop across your selected portfolio of symbols. The system presents these trading opportunities through an intuitive color-coded button int

Summorai this indicator will Sum up to 5 moving average of different symbols and place them conveniently on your chart
How to use? just drop the indicator on a chart and fill in the symbol names exactly as they appear on your market watch
by doing so your can have a grip on the global trend at all time
example of use you trade DAX40 on your indicator chart its good to have Nasdaq100 and s&p500 and dow30 making sure trend confirmation
example 2 you trade XRP but wants to have BTC and ETH not
FREE
The Donchian Time Sync Analyzer brings powerful multi-timeframe dimension to classic Donchian channel analysis, allowing traders to simultaneously monitor trend strength and potential reversal signals across five different chart periods. This advanced indicator calculates the highest highs and lowest lows across your selected timeframes, generating clear visual signals that help identify convergence of trend direction across multiple time horizons. By providing coordinated an
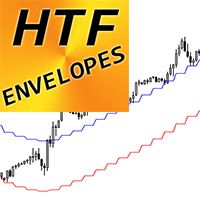
Crypto_Forex Indicator "HTF Envelopes" for MT4.
- Upgrade your trading methods with the professional HTF Envelopes for MT4. HTF means - higher timeframe. - Envelopes is one of the best trend indicator on the market - perfect tool for trading. - It is used to help traders to identify extreme overbought and oversold conditions as well as trading ranges. - HTF Envelopes indicator is excellent for Multi-Time Frame trading systems with Price Action entries or in combination with other indicators. -
Take full control of your trading time. BarCounter solves one of the biggest challenges in intraday trading: the accuracy of bar counting. This smart and lightweight indicator automatically counts every candle formed since the day's opening, allowing you to monitor the session's progress with total confidence. It is essential for those who need strict time tracking, as it turns uncertainty into clarity and manual counting into an automated operation.

Scalpetronix Indicator — the signal core of the Scalpetronix robot. This indicator implements the algorithms and signals on which the Scalpetronix Expert Advisor operates. All entries of the robot are generated based on these calculations: a combination of exponential moving averages, trend filtering via ADX, volatility normalization through ATR, and bar structure analysis. Advantages of the indicator works on a multi-level EMA system (fast and slow) with a dynamic threshold; eliminates weak si
ChartFix – Fixed Scale and Pan Chart Controls for MT4 ChartFix is a lightweight indicator that adds convenient on-chart navigation tools to MetaTrader 4. The controls are designed to offer a chart interaction style that creates an optional switch between MT4 default auto scale feature and a fixed scale chart that can be moved up and down and easily scaled vertically. Main Functions Zoom In / Zoom Out – Adjust the chart scale directly from on-screen buttons. Scale Mode Switch – Toggle between MT4

First time on MetaTrader, introducing IQ Star Lines - an original Vedic Astrology based indicator. IQ Star Lines, an unique astrological indicator purely based on Vedic astrology calculations, published for the first time on Metatrader. This unique tool plots dynamic planetary grid lines based on real-time stars, constellations, and celestial movements, which allows you to plot the power of the cosmos directly onto your trading charts. This indicator is specifically designed for scalpers
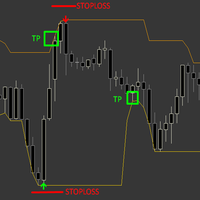
The Sure Reverse Channel is a dynamic non repaint trend indicator with entry arrows, the indicator focuses on catching a reverse swing in the market by using channel and price action formula, the indicator comes with built-in money management . HOW TO TRADE : Open buy trade when buy arrow pops up and set your SL below arrow, for TP you have TP which is opposite band. Open sell trade when sell arrow pops up and set your SL above arrow, for TP you have TP which is opposite band. band.
Why is
FREE

Quantum Arrow is a powerful Non-Repainting indicator specifically designed for the XAUUSD M15 timeframe, though it works effectively on any symbol and any timeframe. The indicator includes many useful features such as alerts, popups, and push notifications, offering flexibility for traders to adjust its values according to their preferences. Its price is highly affordable compared to the value and quality of the signals it provides. For any questions or support, please feel free to contact. Than
The TPX Supply Demand indicator will alert you to detect supply and demand areas. With the risk/reward filter, you'll only receive alerts if they match your chosen configuration. With the first-touch filter, alerts will only be issued in colored areas that haven't been touched yet, meaning they haven't yet been settled and have the greatest potential for reaction. Once the area is touched, only the border remains. Entry and stop-loss values are available both in the alerts and on the screen.
FREE

Stop Trading Random Signals. Start Trading with Real Confluence Are you tired of indicators that repaint, give conflicting signals, and leave you more confused than confident? The Quantum Regime Indicator is a professional, standalone trading tool designed for serious traders who demand a systematic edge. It solves the biggest problem in technical analysis— false signals —by using a powerful multi-engine framework. Every signal is confirmed by a confluence of market conditions , ensuring you onl
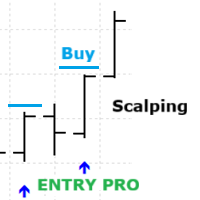
Altopium Scalping Entry Pro automatically identifies scalping opportunities. The indicator is highly sensitive to trend changes, making it ideal for pure, rapid scalping. The best way to use Scalping Entry Pro signals is to follow the short-term trend.
First step: Identify the short-term trend (you can see several examples in the screenshots). Second step: Consider Scalping Entry Pro signals only in the direction of the short-term trend.
Entry: When the bar closes and the arrow is confirmed,
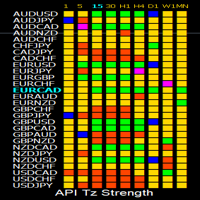
API Tz Strength Indicator MT4 – All-in-One Strength Dashboard for 28 Symbols and 9 Timeframes Take your Strength analysis to the next level with one powerful dashboard. The API Tz Strength Indicator MT4 is designed for traders who want to track market strength and reversals across multiple symbols and timeframes – all from a single chart. With advanced clickable controls, customizable watchlists, and smart alerts, this tool simplifies multi-symbol, multi-timeframe analysis like never before. ___
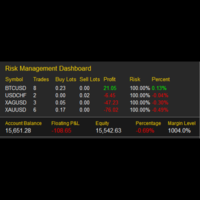
My Risk Management The Risk Management Dashboard is a visual tool designed to help traders monitor risk exposure in real time. With a clear and compact layout, it provides an instant overview of trading activity, enabling more disciplined and informed decision-making. Key Features Active Symbol Summary
Displays all traded symbols with the number of trades, total buy/sell lots, and current profit/loss. Per-Symbol Risk Analysis
Calculates and shows the risk percentage of each symbol relative to
FREE
HTF MACD – Trend-Aligned Signals (one subwindow, arrows on chart) What it does
This indicator keeps you trading with the higher-timeframe trend while using MACD crosses for precise entries. In a single subwindow it shows: HTF Trend Histogram — green = uptrend, red = downtrend (neutral is hidden for a cleaner view) MACD Lines — blue = MACD main, orange = MACD signal Arrows on the price chart when a valid, trend-aligned MACD cross occurs Optional alerts on bar close Entry logic (strict, closed-ba
FREE
MetaTrader Market - trading robots and technical indicators for traders are available right in your trading terminal.
The MQL5.community payment system is available to all registered users of the MQL5.com site for transactions on MetaTrader Services. You can deposit and withdraw money using WebMoney, PayPal or a bank card.
You are missing trading opportunities:
- Free trading apps
- Over 8,000 signals for copying
- Economic news for exploring financial markets
Registration
Log in
If you do not have an account, please register
Allow the use of cookies to log in to the MQL5.com website.
Please enable the necessary setting in your browser, otherwise you will not be able to log in.