Market Condition Evaluation based on standard indicators in Metatrader 5 - page 140
You are missing trading opportunities:
- Free trading apps
- Over 8,000 signals for copying
- Economic news for exploring financial markets
Registration
Log in
You agree to website policy and terms of use
If you do not have an account, please register
Forum on trading, automated trading systems and testing trading strategies
Forecast for Q1'16 - levels for GOLD (XAU/USD)
Sergey Golubev, 2016.01.11 15:11
GOLD (XAU/USD) Price Action Analysis - ranging near bullish reversal
Daily price is located below 200 period SMA (200 SMA) and near below 100 period SMA (100 SMA) for the primary bearish market condition on the border between the primary bearish and the ranging bearish trend:
If the price will break Fibo resistance level at 1113.12 so we may see the ranging condition to be started with the good possibility to the bullish reversal in the near future.
If the price will break Fibo support level at 1046.23 from above to below so the primary bearish trend will be continuing.
If not so the price will be ranging within the levels.
Forum on trading, automated trading systems and testing trading strategies
Press review
Sergey Golubev, 2016.01.12 09:32
Strongest Quant Signals This Week - SEB (based on the article)
Daily price is located below SMA with period 100 (100-SMA) and below SMA with the period 200 (200-SMA) within 23.6% Fibo resistance at 118.30 and Fibo support level at 116.69. Descending triangle pattern was formed by the price with 117.22 support to be crossed for the bearish trend to be continuing for 116.69 target to re-enter.
SUMMARY : ranging
TREND : bearishForum on trading, automated trading systems and testing trading strategies
Press review
Sergey Golubev, 2016.01.12 10:45
GBP/USD Intra-Day Fundamentals - Manufacturing Production and 39 pips price movement
2016-01-12 09:30 GMT | [GBP - Manufacturing Production]
if actual > forecast (or previous one) = good for currency (for GBP in our case)
[GBP - Manufacturing Production] = Change in the total inflation-adjusted value of output produced by manufacturers.
==========
==========
GBPUSD M5: 39 pips price movement by GBP - Manufacturing Production news event :
Forum on trading, automated trading systems and testing trading strategies
Forecast for Q1'16 - levels for EUR/USD
Sergey Golubev, 2016.01.12 11:06
EUR/USD Intra-Day Technical Analysis - intra-day bearish breakdown
M5 price is located below SMA with period 100 (100-SMA) and below SMA with the period 200 (200-SMA) for the bearish breakdown with the crossing Fibo support level at 1.0851 to below for the bearish trend to be continuing, RSI indicator is estimating the bearish market condition in the near future for this timeframe.
SUMMARY : bearish
TREND : breakdownForum on trading, automated trading systems and testing trading strategies
Repainting Articles
Sergey Golubev, 2013.07.09 12:26
I did not find education trading articles about repainting and non-repainting. I think - you should look at the forum posts.
For example - there are the following indicators by categories :
- non-repainting. Most of the indicators are inside this category (most of the indicators are non-repainting). It means: if you see the signal so wait for the bar with the signal to be closed and new bar is opened. Traders are using non-repainting indicators to trade on close bar (classical way of trading for most of the traders). Some people confused 'non-repainting' with 'continuing painting'. For example, open bar is continuing paiting by itself together with value of any indicator. Close bar is not repainting by value together with non-repainting indicator.
- repainting indicators. There are many of them which were created especially for some different cases. Zigzag for example. Some of those indicators are used as the filters to filter false 'non-repainting signals' from the other indicators.
- re-calculating indicators. The values of those indicators are recalculated for n number of the bars. Indicators can be used a the filters or for technical analysis (not for direct trading).
- repainting by mistake made by coders. There are many examples of the indicators coded by coders in repainting way as the mistake (such as super signals etc).
===========
Sometimes - the people confused repainting with contrinuing painting, and trading on open bar with trading on close bar. We are having a lot of threads/articles about programming but just few threads about how to trade in practical way with a lot of indicators in CodeBase for example :)
Forum on trading, automated trading systems and testing trading strategies
Press review
Sergey Golubev, 2016.01.13 14:58
Intra-Day Fundamentals - China CGAC Trade Balance and 67 pips price movement for majors
2016-01-13 02:00 GMT | [CNY - CGAC Trade Balance]
if actual > forecast (or previous one) = good for currency (for CNY in our case)
[CNY - CGAC Trade Balance] = Difference in value between imported and exported goods during the previous month. Export demand/currency demand are directly linked with each other: foreigners buy the domestic currency to pay for the exports.
==========
EURUSD M5: 14 pips price movement by CNY - CGAC Trade Balance news event :
==========
GBPUSD M5: 11 pips price movement by CNY - CGAC Trade Balance news event :
==========
USDJPY M5: 31 pips price movement by CNY - CGAC Trade Balance news event :
==========
USDCHF M5: 11 pips price movement by CNY - CGAC Trade Balance news event :
Forum on trading, automated trading systems and testing trading strategies
Press review
Sergey Golubev, 2016.01.14 09:40
AUD/USD Intra-Day Fundamentals - Employment Change and 37 pips range price movement
2016-01-14 00:30 GMT | [AUD - Employment Change]
if actual > forecast (or previous one) = good for currency (for AUD in our case)
[AUD - Employment Change] = Change in the number of employed people during the previous month.
==========
==========
AUDUSD M5: 37 pips range price movement by AUD - Employment Change news event :
Forum on trading, automated trading systems and testing trading strategies
Press review
Sergey Golubev, 2016.01.14 10:13
USDJPY Technical Analysis 2016, January 14: ranging bearish (adapted from the article)D1 price is on primary bearish market condition:
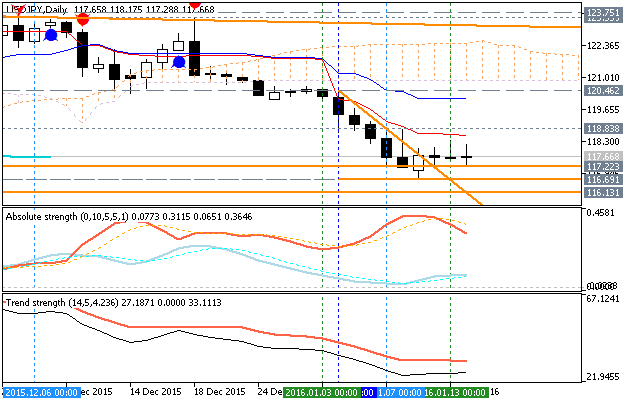
If the price will break 117.22 support level so the primary bearish will be continuing with 116.13 target to re-enter.If the price will break 118.83 resistance level so the local uptrend as the bear market rally will be started.
If the price will break 123.75 resistance level so the price will be fully reversed to the bullish market condition with good breakout possibility.
If not so the price will be ranging within the levels.
SUMMARY : bearish
TREND : breakdown of support levels
Forum on trading, automated trading systems and testing trading strategies
Forecast for Q1'16 - levels for EUR/USD
Sergey Golubev, 2016.01.14 11:28
EURUSD Technical Analysis 2016, January: ranging for directionD1 price is on bearish ranging condition located inside Ichimoku cloud waiting for direction:
If the price will break 1.0710 support level so the primary bearish will be continuing with 1.0522 target to re-enter.
If the price will break 1.1059 resistance level so the reversal of the price movement from the primary bearish to the primary bullish trend will be started.
If not so the price will be ranging within the levels.
TREND : waiting for direction
Forum on trading, automated trading systems and testing trading strategies
Press review
Sergey Golubev, 2016.01.14 14:30
GBP/USD Intra-Day Fundamentals - Official Bank Rate and 54 pips price movement
2016-01-14 12:00 GMT | [GBP - Official Bank Rate]
if actual > forecast (or previous one) = good for currency (for GBP in our case)
[GBP - Official Bank Rate] = Interest rate at which the BOE lends to financial institutions overnight.
==========
"The Bank of England’s Monetary Policy Committee (MPC) sets monetary policy in order to meet the 2% inflation target and in a way that helps to sustain growth and employment. At its meeting ending on 13 January 2016, the MPC voted by a majority of 8-1 to maintain Bank Rate at 0.5%. The Committee voted unanimously to maintain the stock of purchased assets financed by the issuance of central bank reserves at £375 billion, and so to re-invest the £8.4 billion of cash flows associated with the redemption of the January 2016 gilt held in the Asset Purchase Facility."==========
GBPUSD M5: 54 pips price movement by GBP - Official Bank Rate news event :